
Pricing Free

Candlestick by OKVIZ
by OKVIZ Corp.
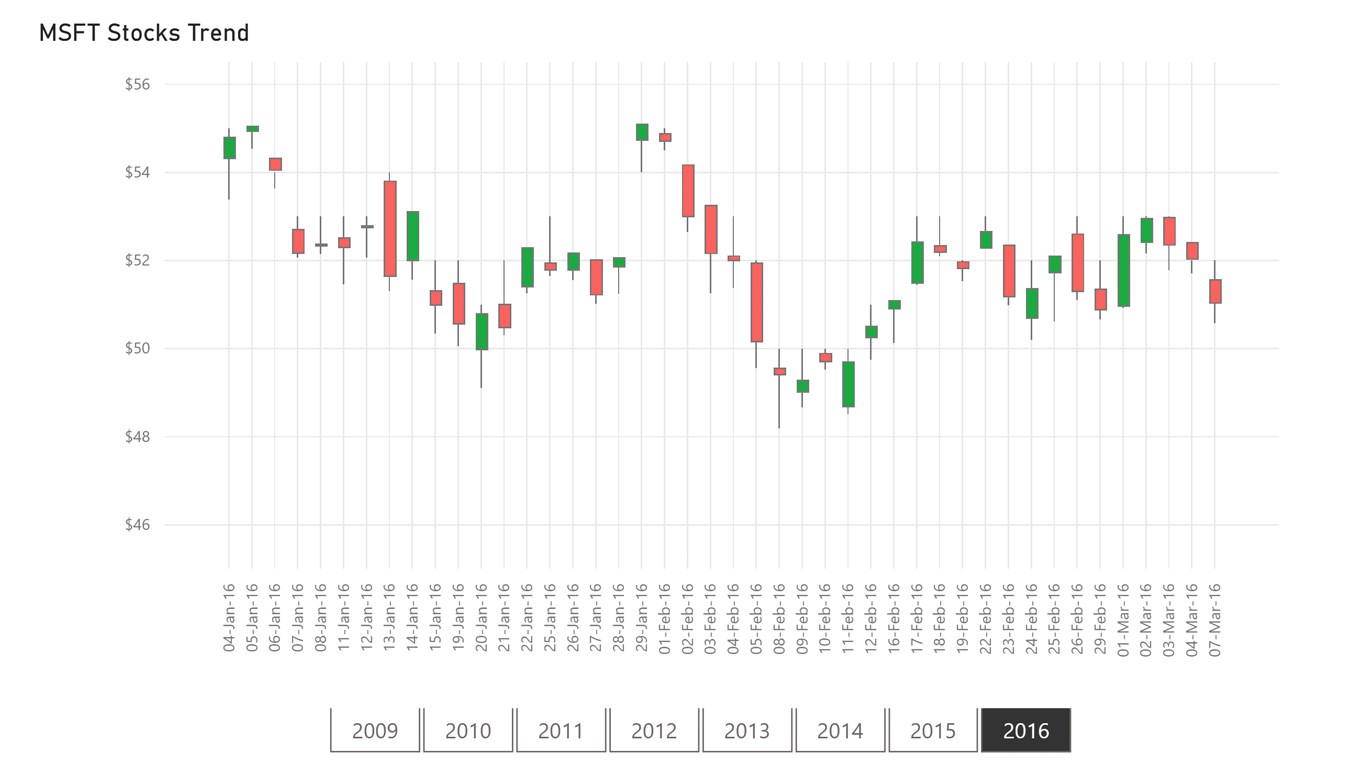
Presents stock data using a specialized chart made up of several candles.
Candlestick by OKVIZ is used to describe the price variations of a stock, derivative, or currency.
Each candle in the chart typically shows four price values: high, low, open, and close. This visual allows you to define multiple trend lines for analytics purposes, such as the Bollinger Bands.
Resources
Visual capabilities
This visual is certified by Power BI
At a glance
Other apps from OKVIZ Corp.

Card with States by OKVIZOKVIZ Corp. Power BI visualsCombines metrics, states, KPIs, and a trend line. Multiple cards available
Applicable to:Power BI visuals
NaN out of 5
Smart Filter by OKVIZOKVIZ Corp.Power BI visualsAn advanced slicer for your Power BI reports.
Applicable to:Power BI visuals
NaN out of 5
Bullet Chart by OKVIZOKVIZ Corp.Power BI visualsShowcase performance vs. targets with precision using the best Bullet Chart for Power BI!
Applicable to:Power BI visuals
NaN out of 5
Sparkline by OKVIZOKVIZ Corp.Power BI visualsDisplays the trend of multiple measures or category items on a single line, minimizing the footprint
Applicable to:Power BI visuals
NaN out of 5
Smart Filter Pro by OKVIZOKVIZ Corp.Power BI visualsThe fastest slicer and search bar for your Power BI reports.
Applicable to:Power BI visuals
NaN out of 5
By getting this product, I give Microsoft permission to use or share my account information so that the provider can contact me regarding this product and related products. I agree to the provider's terms of use and privacy policy and understand that the rights to use this product do not come from Microsoft, unless Microsoft is the provider. Use of AppSource is governed by separate terms and privacy.