
Pricing Free
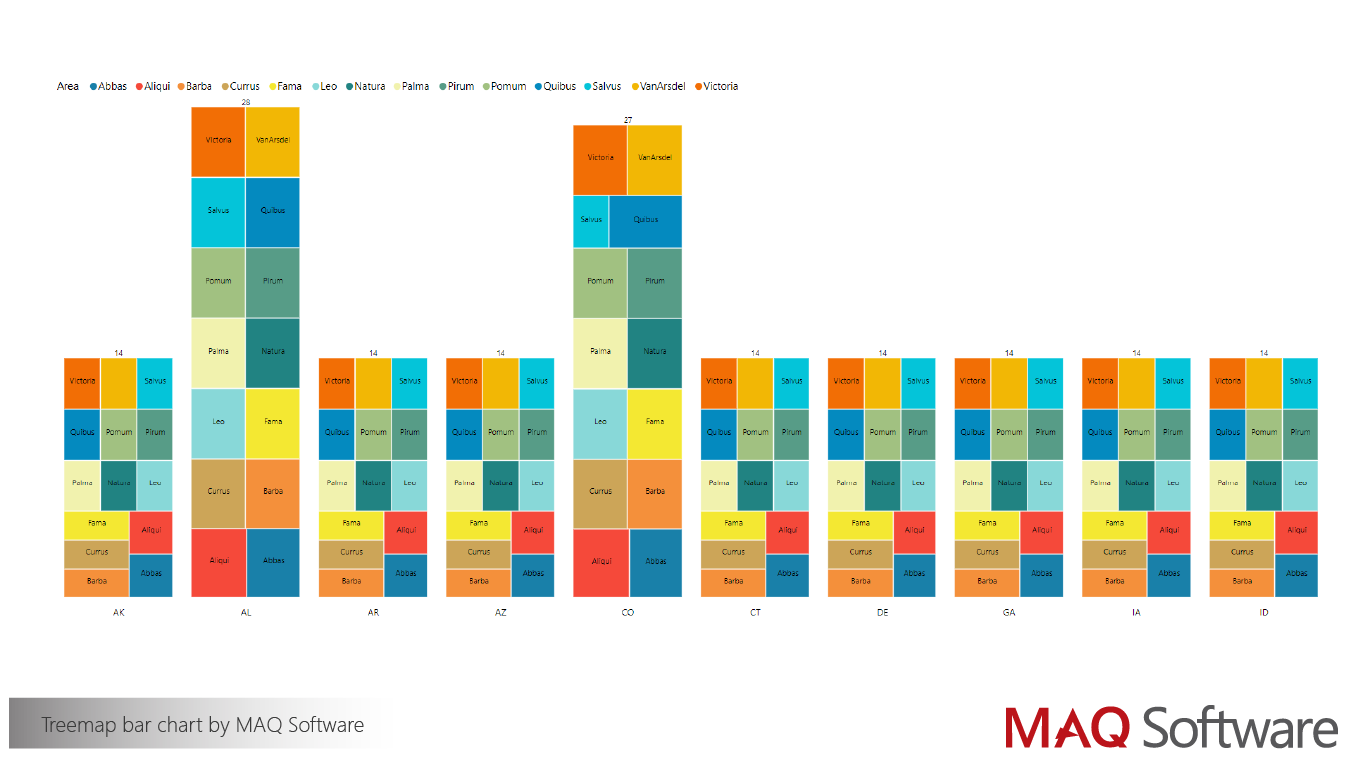
Treemap Bar Chart by MAQ Software
by MAQ LLC
Categorize hierarchical data with color-coded, proportional rectangles
Treemap Bar Chart by MAQ Software categorizes hierarchical data with sets of colored rectangles of proportionate sizes. The visual offers multiple views to ensure you gain the insights you need. Visualize performance with the gradient effect and size of bricks while making an efficient use of space by showing the distribution of values across categories.
Business Uses:
- Sales: Analyze profit breakdown needs by country, region, and city
- Marketing: Highlight the performance of campaigns across location
- Social Media Marketing: Break down ROI on social media campaigns by platform
Key Features:
- Customizable brick colors
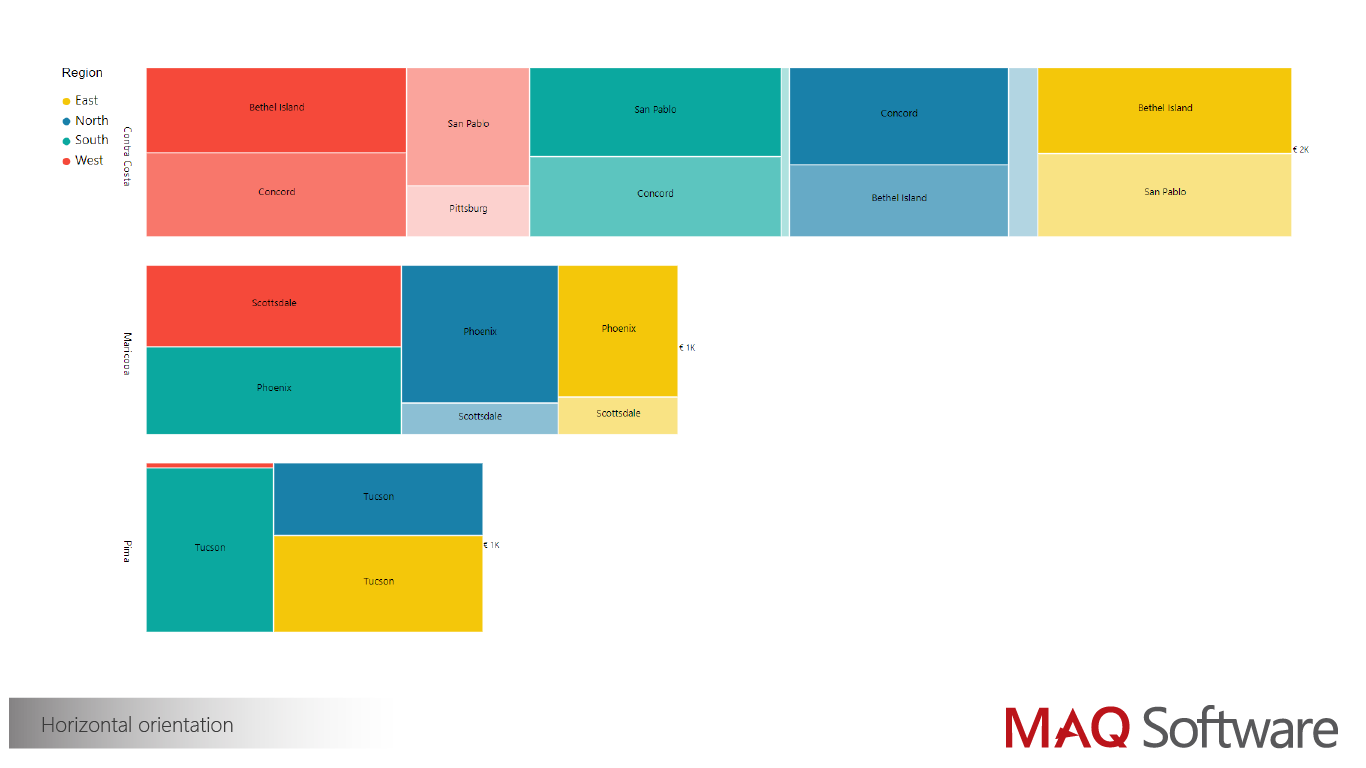
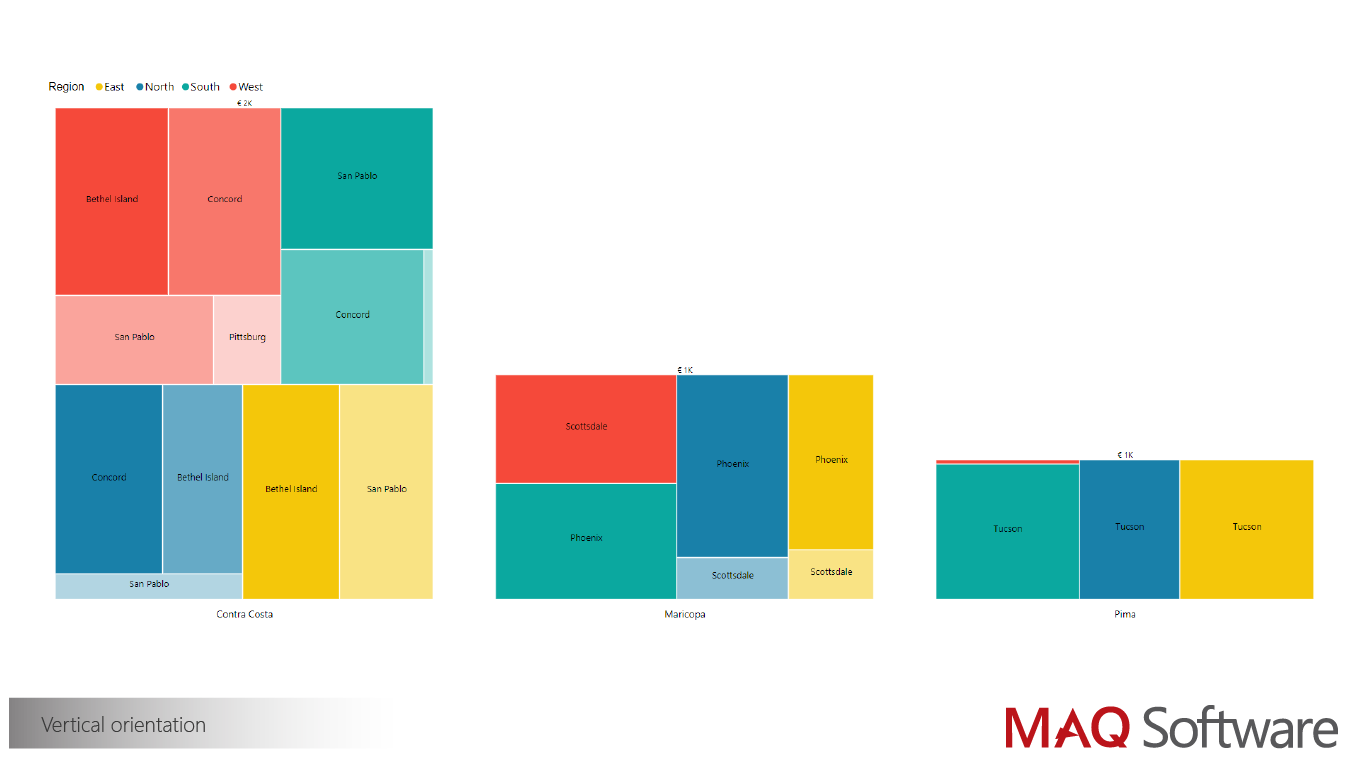
- Customizable orientation between bar chart and column chart
- Total values and data labels for all categories
- Custom text and background colors
- Tooltips with additional insights
- Data legend
- Animation to examine the visual at the granular level
- Cross-filtering support for legend values, axis values, and bricks
- Bookmark support
- Report tooltips configuration support
- Drill through support
What's new in 4.0.0:
- Context menu support
Contact Us:
Thank you for using Treemap Bar Chart by MAQ Software.
Do you have questions about this or any of our other Power BI custom visuals? Check out our community pages on Zendesk: https://bit.ly/maqsoftware-support
Visual capabilities
This visual is certified by Power BI
At a glance

Other apps from MAQ LLC

Gantt Chart by MAQ SoftwareMAQ LLC Power BI visualsGantt chart for effective project management | Power BI Certified
Applicable to:Power BI visuals
NaN out of 5
Box and Whisker chart by MAQ SoftwareMAQ LLCPower BI visualsEfficiently analyze and compare data distributions | Power BI Certified
Applicable to:Power BI visuals
NaN out of 5
Calendar by MAQ SoftwareMAQ LLCPower BI visualsStreamline event tracking in Power BI | Power BI Certified
Applicable to:Power BI visuals
NaN out of 5
Hierarchy Chart by MAQ SoftwareMAQ LLCPower BI visualsStreamline your organizational insights | Power BI Certified
Applicable to:Power BI visuals
NaN out of 5
Cylindrical Gauge by MAQ SoftwareMAQ LLCPower BI visualsVisualize targets with precision | Power BI Certified
Applicable to:Power BI visuals
NaN out of 5
By getting this product, I give Microsoft permission to use or share my account information so that the provider can contact me regarding this product and related products. I agree to the provider's terms of use and privacy policy and understand that the rights to use this product do not come from Microsoft, unless Microsoft is the provider. Use of AppSource is governed by separate terms and privacy.