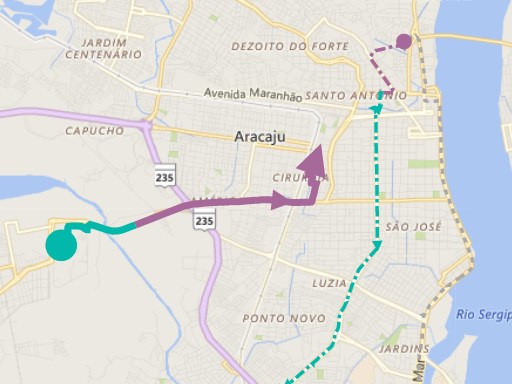
Visualize trajectories on a map
Route map is designed to visualize trajectories of objects, such as taxis, vessels, airplanes, and hurricanes. Specifically, a trajectory dataset often contains three aspects of information: time, geo-coordinate, and attribute. In this visual, you can draw the spatial-temporal information on a map with polylines, then use line styles (e.g., colors and widths) to encode desired attributes. For more details, please visit: https://weiweicui.github.io/PowerBI-Routemap/
Visual capabilities
When this visual is used, it
- Can access external services or resources
At a glance