FiltersClear all
Apps results
Showing 751 results in apps.
Power BI visualsRemove Power BI visuals
Power PlatformRemove Power Platform

orcaviz-proOrcaViz Power BI visualsBring location intelligence to PowerBI with Orcaviz.com custom visuals
Applicable to: Power BI visuals
1 out of 60
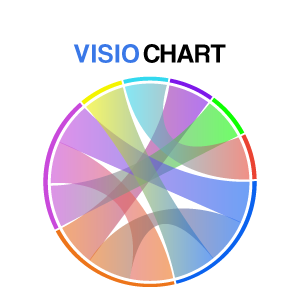
Chord DiagramVisioChart Power BI visualsChord Diagram visualizes complex data with customizable chords, colors, and interactive features
Applicable to: Power BI visuals
2 out of 60

WeWrite TableSOLVED Power BI visualsA custom table visual with write-back capabilities
Applicable to: Power BI visuals
3 out of 60

KPI Performance CardSamed Uluçay Power BI visualsTrack real-time performance in Power BI with KPI Performance Card! 🚀
Applicable to: Power BI visuals
4 out of 60
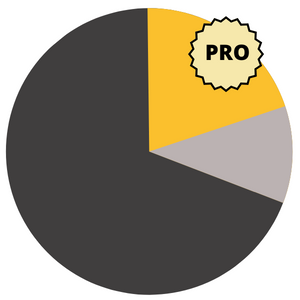
Advanced Donut and Pie Chart (Pro)PBIVizEdit.com Power BI visualsVisualize the dominating or underperforming categories of the total
Applicable to: Power BI visuals
5 out of 60

Multiparent-Tree Table - BI-AutomationRobert Buk Power BI visualsVisualize complex hierarchies with the Multiparent-Tree Table for unmatched data clarity
Applicable to: Power BI visuals
6 out of 60

Animator by SquillionSquillion Technology Private Limited Power BI visualsElevate your reports with dynamic, engaging visuals that uncover insights and start conversations
Applicable to: Power BI visuals
7 out of 60

ValQ-PlanxViz LLC Power BI visualsValQ for planning, budgeting, forecasting, what-if simulations, scenario analysis and reporting
Applicable to: Power BI visuals
8 out of 60

Promo Projection Chart by Office SolutionOffice Solution Power BI visualsUse this chart to gain insights into marketing ROI, highlighting top channels and areas to improve.
Applicable to: Power BI visuals
9 out of 60

AI Buddy by iFouriFour Technolab Pvt. Ltd. Power BI visualsAI Buddy lets users chat with Power BI data, gaining instant insights, summaries, and explanations
Applicable to: Power BI visuals
10 out of 60

PackedBubbleChartQatar Financial Centre Regulatory Authority Power BI visualsPacked Bubble Chart
Applicable to: Power BI visuals

Icons by QueryonQueryon Power BI visualsAccess hundreds of open-source icons to elevate your user experience.
Applicable to: Power BI visuals
12 out of 60
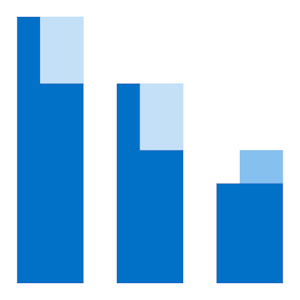
Variance Chartpbi-consultants Power BI visualsCreate professional column and bar charts that effectively highlight variances
Applicable to: Power BI visuals
13 out of 60
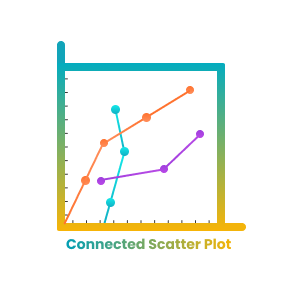
Connected Scatter Plot Chart For Power BIOffice Solution Power BI visualsA connected scatter plot is a type of data visualization that show the data of X and Y axis
Applicable to: Power BI visuals
14 out of 60

Population Pyramid (Pro)PBIVizEdit.com Power BI visualsGraphically illustrate age and gender distribution of a given population
Applicable to: Power BI visuals
15 out of 60

JobNet VisualPOPFINGER IT Consulting Power BI visualsVisualize your parallel processes in a Gantt chart fashion to identify performance bottlenecks.
Applicable to: Power BI visuals
16 out of 60
Multi-Format / Animation / Text From Values Card (BI-Champ suite)CodeX Enterprises LLC Power BI visualsTransform source data into a range of output formats - supporting animations, templates and copy
Applicable to: Power BI visuals
17 out of 60
BumpChart by iFouriFour Technolab Pvt. Ltd. Power BI visualsThe Bump Chart for Power BI tracks ranking changes over time, highlighting trends.
Applicable to: Power BI visuals
18 out of 60

SkylineAWPBI Power BI visualsVisually intuitive way of mapping activities into groups or dates.
Applicable to: Power BI visuals
19 out of 60
Event Horizon Timeline ChartSoftcial Power BI Power BI visualsPower BI visual for tracking and analyzing milestones in a timeline fashion
Applicable to: Power BI visuals
20 out of 60

Overlapping Column (Standard)PBIVizEdit.com Power BI visualsOverlapping columns to compare two numerical variables per category to clearly show surplus/shortage
Applicable to: Power BI visuals
21 out of 60
Traqplan Timeline ProTraqplan Power BI visualsCreates a plan on a page or gantt timeline for multiple projects with edge-wrap and change tracking.
Applicable to: Power BI visuals
22 out of 60

Drill Down Graph PRO (Pin) by ZoomChartsZoomCharts Power BI visualsBuild networks and explore relations within them with the first true graph visual for Power BI.
Applicable to: Power BI visuals
23 out of 60
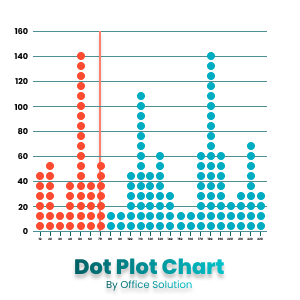
Dot Plot Chart by Office SolutionOffice Solution Power BI visualsDot plot chart by office solution
Applicable to: Power BI visuals
24 out of 60

Balanced ScorecardTechanesis Ltd Power BI visualsTransform your organization's performance tracking and decision-making with a Balanced Scorecard
Applicable to: Power BI visuals
25 out of 60

Drill Down Map PRO (Pin) by ZoomChartsZoomCharts Power BI visualsExplore location data with powerful on-chart filtering capabilities.
Applicable to: Power BI visuals
26 out of 60

Matrix planning - Dynamics 365 Finance business performance planningMicrosoft Dynamics 365 Power BI visualsDesign powerful planning and forecasting scenarios with data editing capabilities.
Applicable to: Power BI visuals
27 out of 60

Markdown & Mermaid VisualIlfat Galiev Power BI visualsMarkdown viewer and editor for Power BI with Mermaid Diagramming and charting tool
Applicable to: Power BI visuals
28 out of 60

Metro MapViz Data Ltd Power BI visualsTransform complex distribution steps into a clear, metro-style map that can help reveal bottlenecks
Applicable to: Power BI visuals
29 out of 60

Income Statement TableRYCO Insight AS Power BI visualsSimplify income statement visualization with built-in margin calculations
Applicable to: Power BI visuals
30 out of 60

E-Project Smart SlicerE-Project Srl Power BI visualsCustom slicer with additional performance and customization features
Applicable to: Power BI visuals
31 out of 60

时勤-Calendar1上海时勤信息科技有限公司 Power BI visualsThis product is an advanced visualization object designed for Power BI users to provide an intuitive
Applicable to: Power BI visuals
32 out of 60

Dual Axis Scatter Chart (Standard)PBIVizEdit.com Power BI visualsA powerful visual to compare two sets of data with a dual-axis scatter plot
Applicable to: Power BI visuals
33 out of 60

WorkstreamEngagy P.S.A. Power BI visualsWorkstream: Hierarchical Visualization for Microsoft Power BI
Applicable to: Power BI visuals
34 out of 60

JVIZ Gantt ChartJINETT Inc. Power BI visualsStay in control of your project portfolio and organize tasks into an engaging presentation.
Applicable to: Power BI visuals
35 out of 60
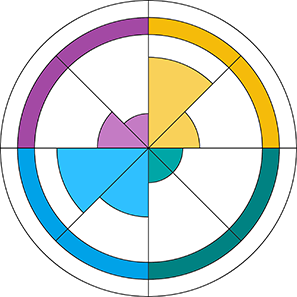
vuurmans_custom_polar_area_chartVuurmans Consultancy Power BI visualsPolar area chart with bifold categorization
Applicable to: Power BI visuals
36 out of 60

Acterys Smart XLManagility Power BI visualsActerys Smart XL Visual for Power BI: Excel Flexibility and Dynamic Planning
Applicable to: Power BI visuals
37 out of 60
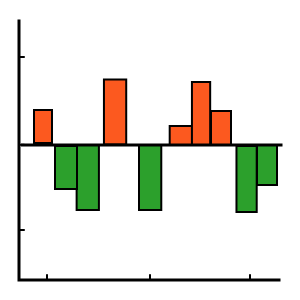
Hat Graph by iFouriFour Technolab Pvt. Ltd. Power BI visualsThe visual uses vertical bars with caps to highlight thresholds or baselines, simplifying comparison
Applicable to: Power BI visuals
38 out of 60

Seasonal ChartVector Forge Power BI visualsPlot time-series data, identify patterns, and compare year-over-year trends with ease
Applicable to: Power BI visuals
39 out of 60

Status TrackerViz Data Ltd Power BI visualsBeautiful visual, comparing status across your categories with traffic light system
Applicable to: Power BI visuals
40 out of 60

ArcGIS for Power BIEsri, Inc. Power BI visualsCustom data visualization to bring mapping capabilities to your reports and dashboards.
Applicable to: Power BI visuals
41 out of 60

Markdown Viewer - LeapLyticsLeapLytics GmbH Power BI visualsIntroducing the Markdown-to-HTML Visual for Power BI: Unleash the Power of Text Formatting!
Applicable to: Power BI visuals
42 out of 60

Writeback GridCreative Data Power BI visualsUnlocks advanced data editing and seamless writeback using an intuitive grid visual
Applicable to: Power BI visuals
43 out of 60

DividersViz Data Ltd Power BI visualsInteractive, space-saving category filters for Power BI—styled as sleek, data-driven tabs.
Applicable to: Power BI visuals
44 out of 60

Comparison Bar Chart For Power Bi by ChartExpopolyvista.com Power BI visualsComparison Bar Chart, A beautiful and advance chart to compare data
Applicable to: Power BI visuals
45 out of 60

Waterfall - What's driving my variations?DataMa Power BI visualsSmart waterfall that illustrates KPIs variations with mix effect, gap analysis, dimension scoring...
Applicable to: Power BI visuals
46 out of 60

Clustered Stacked Bar (Standard)PBIVizEdit.com Power BI visualsTo compare two numerical variables by category with each bar further segmented by sub-categories
Applicable to: Power BI visuals
47 out of 60

Stacked Vertical Funnel (Standard)PBIVizEdit.com Power BI visualsVisualize flow of data across different stages with stacking based on sub-category in each stage.
Applicable to: Power BI visuals
48 out of 60
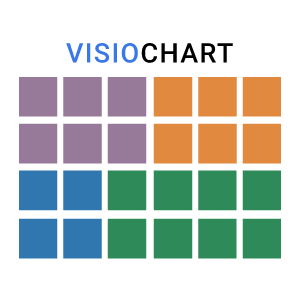
Waffle Chart MakerVisioChart Power BI visualsWaffle Chart for Power BI by VisioChart enhances data visualization, sorting, color customization
Applicable to: Power BI visuals
49 out of 60

Aimplan Comment VisualAimplan AB Power BI visualsExtend Power BI with Rich Text Commenting
Applicable to: Power BI visuals
50 out of 60

Dual X-Axis Combo Chart (Standard)PBIVizEdit.com Power BI visualsShow relationship between data sets by combining bars, lines, scatter, area on dual X-axes
Applicable to: Power BI visuals
51 out of 60

sw3D_StackedBarDiagram上北智信 Power BI visuals3D堆叠图,可渲染多层数据
Applicable to: Power BI visuals

KPI CircleCardCommunicatie in Bedrijf Power BI visualsDisplay your KPI's using Circles
Applicable to: Power BI visuals
53 out of 60

Punchcard (Tabular Bubble Chart) by SquillionSquillion Technology Private Limited Power BI visualsPunchCard for Data Analysis: Multi-Category Support, Dynamic Bubble Charts, Pie/Donut Transformation
Applicable to: Power BI visuals
54 out of 60

Time series Anomaly DetectionDataMa Power BI visualsEffortlessly evaluate the normality of variations over time and explain it.
Applicable to: Power BI visuals
55 out of 60

Aimplan Planning and Reporting VisualAimplan AB Power BI visualsExtend Power BI with Planning, Forecasting, Budgeting, and Financial Reporting
Applicable to: Power BI visuals
56 out of 60

Reporting - Dynamics 365 Finance business performance planningMicrosoft Dynamics 365 Power BI visualsDesign financial reports such as cash flow, income statement, balance sheet and more.
Applicable to: Power BI visuals
57 out of 60

时勤Echart-Basic_Radar_Chart上海时勤信息科技有限公司 Power BI visualsRadar chart is a powerful tool for displaying high-dimensional data of multivariate datasets
Applicable to: Power BI visuals
58 out of 60

WeWrite MatrixSOLVED Power BI visualsA custom matrix visual with write-back capabilities
Applicable to: Power BI visuals
59 out of 60
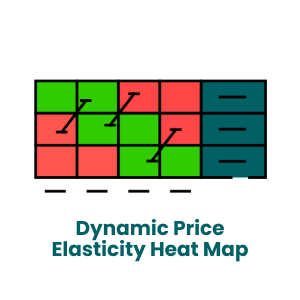
Dynamic Price Elasticity By Office SolutionOffice Solution Power BI visualsPrice elasticity measures how sensitive the demand for a product is to changes in its price.
Applicable to: Power BI visuals
60 out of 60