
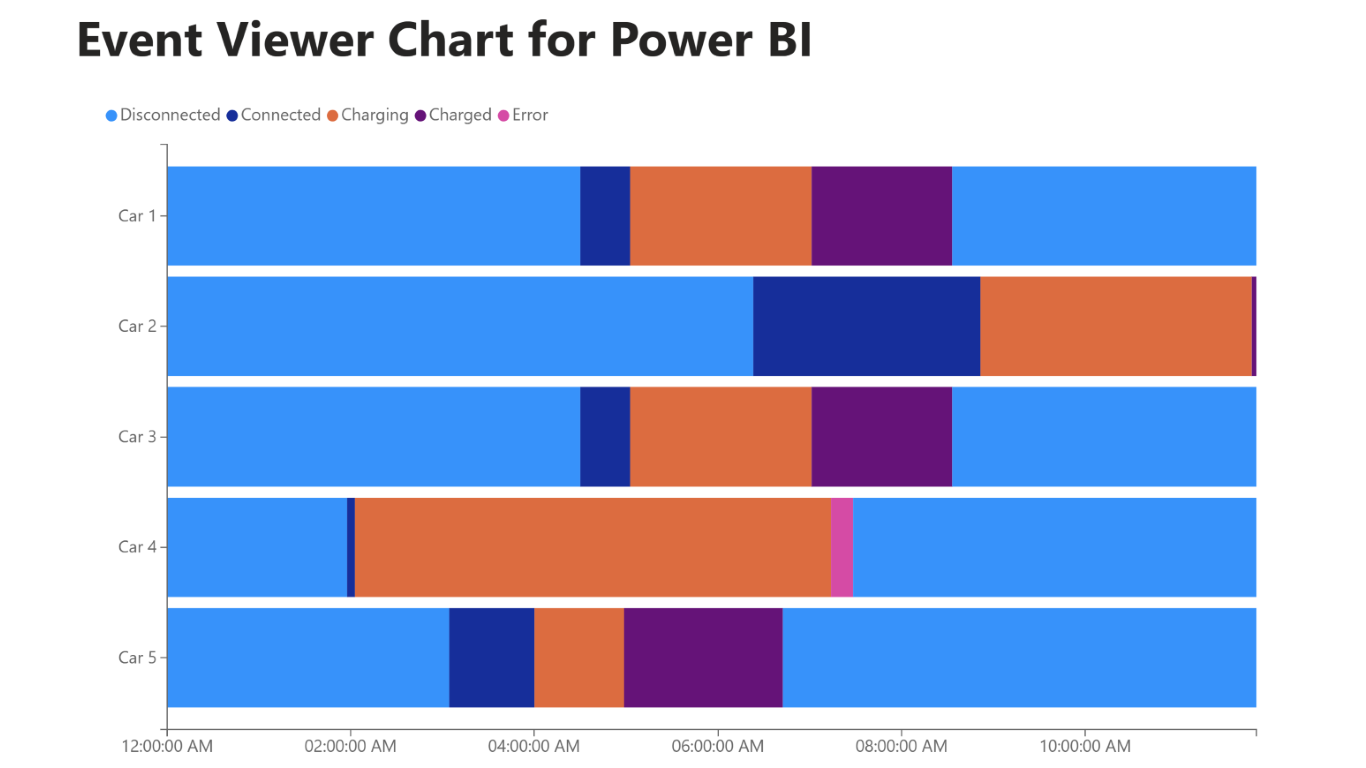
The Event Viewer chart visualizes device events over time. Ideal for IoT devices that report states.
The Event Viewer chart visualizes device events over time by aggregating events per device and timestamp. This behavior is making it an ideal chart to visuals IoT devices.
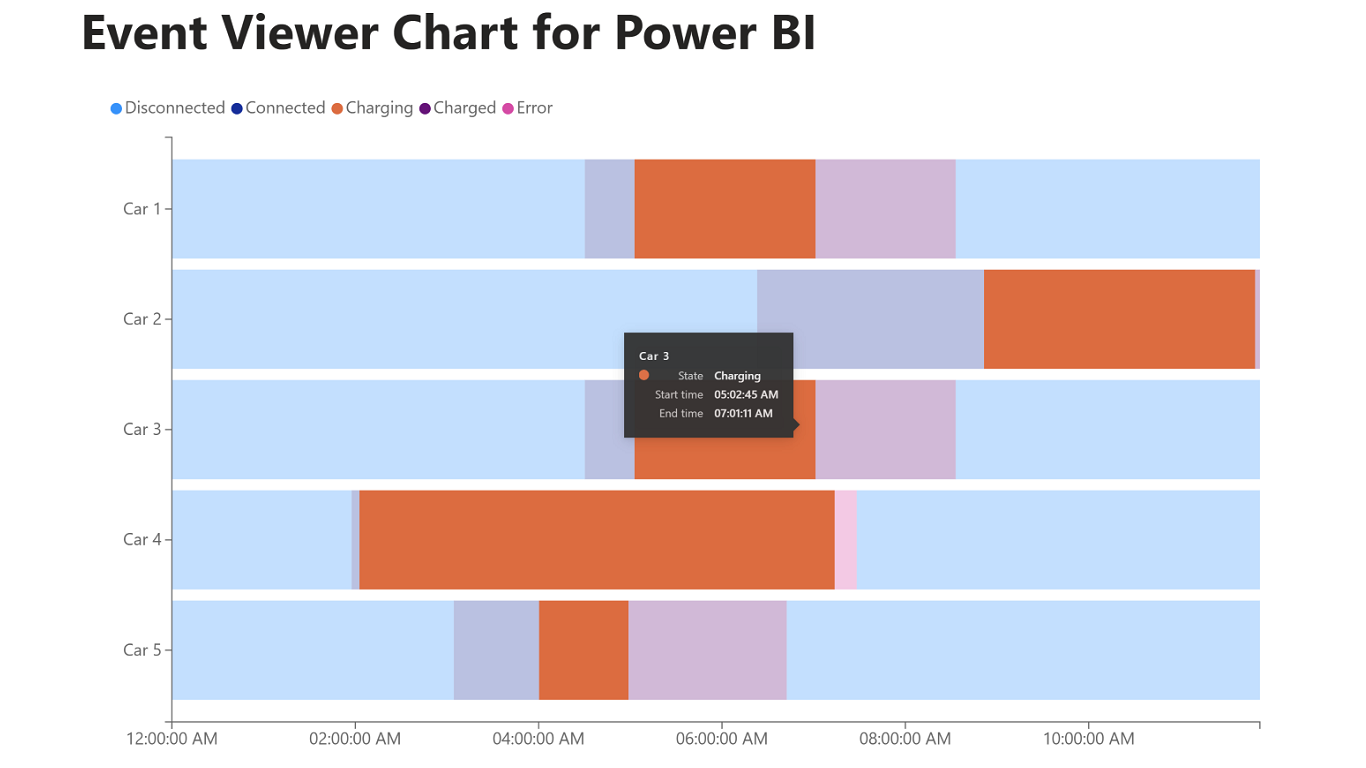
The visual supports highlight to identify when which state is available for a device. And each event has a tooltip to show start and end time of when the device is 'in' that event state.
Release Notes
[1.0]- Initial release
Complete changelog is available at: https://azurebi-docs.jppp.org/powerbi-visuals/event-viewer-changelog.html
- Jan Pieter Posthuma, DataScenarios
Kemampuan visual
Visual ini disertifikasi oleh Power BI
Sekilas
Aplikasi lainnya dari DataScenarios
HierarchySlicerDataScenariosCreate a hierarchy of different fields and use it as a slicer with Power BI.
+1
Applicable to: Power BI visuals
NaN out of 3
Box and Whisker chartDataScenariosVisualize a dataset in an effective way as a five-number summary (mean, median, quartiles, min/max)
+1
Applicable to:Power BI visuals
NaN out of 3
D3.js Visual - create your own custom visualDataScenariosBring your data to life by using HTML, SVG, CSS via the D3.js framework and create your own visual.
+1
Applicable to:Power BI visuals
NaN out of 3