価格 無料

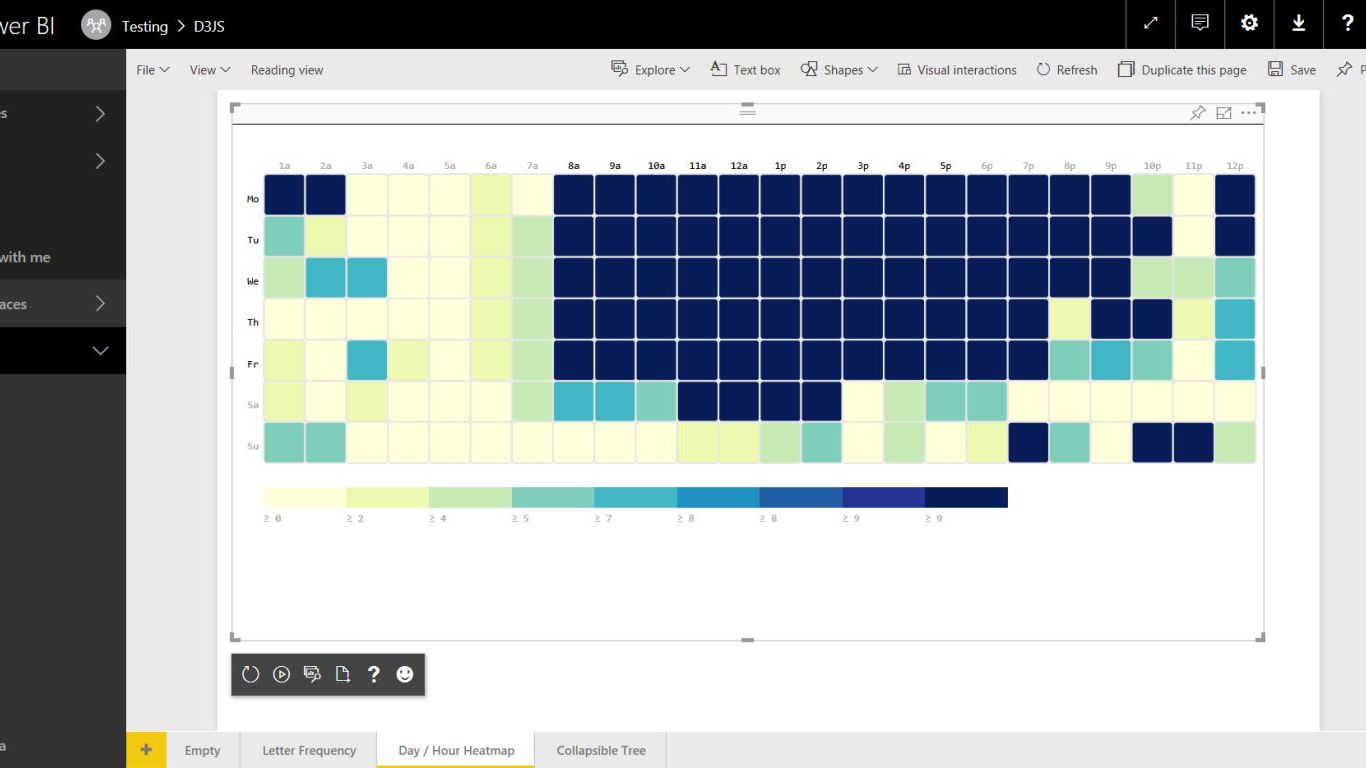
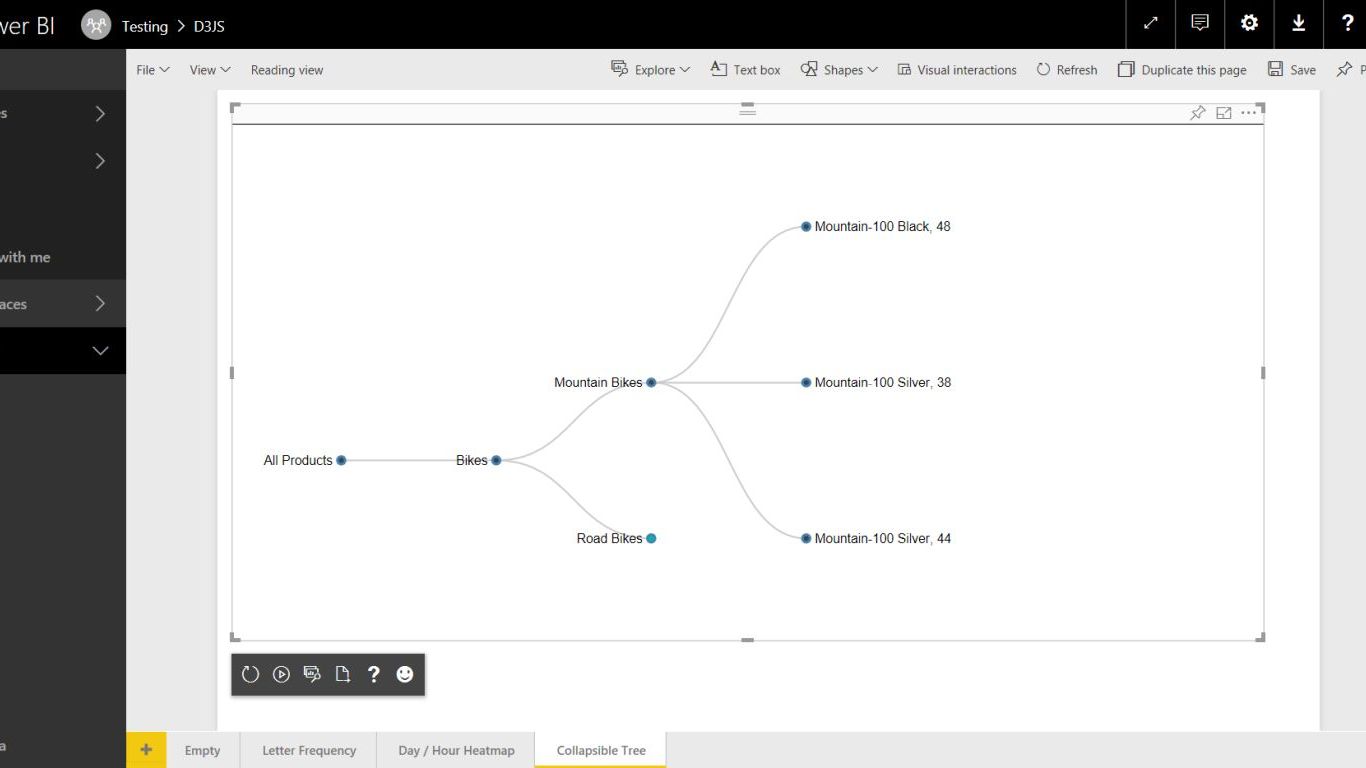
D3.js Visual - create your own custom visual
作成者: DataScenarios
Bring your data to life by using HTML, SVG, CSS via the D3.js framework and create your own visual.
The D3.js Visual for Power BI provides a D3.js skeleton visual that everybody can use to create custom visuals with D3.js. Either the visual can be created from scratch or an existing D3.js visual can be used via a seamless 'lift-and-shift' procedure.
Some alterations are need to get the correct dimensions and the data retrieval. Optional it is possible to alter the color assignment based on the provided color array. A short tutorial can be found at: https://azurebi.jppp.org/power-bi-d3js-visual/
All D3.js visuals run in a frame with the following elements/variables:
SVG element:
- svg xmlns="http://www.w3.org/2000/svg" class="chart" id="chart"
pbi object:
- dsv : function that retrieves the data via the provided callback: pbi.dsv(callback) e.g. pbi.csv(function(data) { //Process data function });
- height : height of the sandbox frame
- width : width of the sandbox frame
- colors : color array with 8 colors; changable via options
Limitations
- D3.js version is v3.5.17
- Maximum amount of datapoints is: 30,000
Release Notes
[1.2.0.0]
- Added several confirmation prompts
- Fixed that the editor is incorrect set to 'readonly'
[1.1.0.0]
- First release to the Office Store
This is an open source visual. Code is available at my GitHub: https://github.com/liprec/powerbi-d3jsvisual
- Jan Pieter Posthuma, DataScenarios
ビジュアル機能
このビジュアルを使用すると次のことが可能です:
- 外部のサービスまたはリソースにアクセスできます
概要
DataScenarios のその他のアプリ

HierarchySlicerDataScenarios Power BI visualsCreate a hierarchy of different fields and use it as a slicer with Power BI.
Applicable to:Power BI visuals
NaN out of 3
Box and Whisker chartDataScenariosPower BI visualsVisualize a dataset in an effective way as a five-number summary (mean, median, quartiles, min/max)
Applicable to:Power BI visuals
NaN out of 3
Event ViewerDataScenariosPower BI visualsThe Event Viewer chart visualizes device events over time. Ideal for IoT devices that report states.
Applicable to:Power BI visuals
NaN out of 3
本製品を取得することで、プロバイダーが本製品および関連製品に関して私に連絡できるように、私のアカウント情報を Microsoft が使用または共有することを許可します。プロバイダーの 使用条件 および プライバシー ポリシー に同意し、Microsoft がプロバイダーである場合を除き、本製品を使用する権利が Microsoft から提供されるものではないことを理解しました。AppSource の使用は、別の 使用条件 および プライバシー に基づいています。