価格 無料
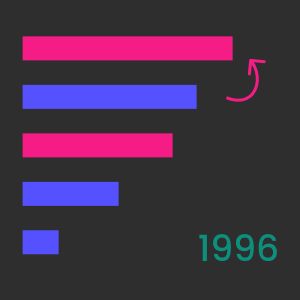
Animated Bar Chart Race
作成者: Wishyoulization
Create fascinating animated trend charts, with bars that race to the top based on ranks.
The animated bar chart race helps you visualize the change in trends over time, these type of charts are very popular on social media as they provide a holistic data story/insight in a concise and easy to understand chart.
This visual has two modes, a standalone mode with autoplay for animation or use as a ranked bar chart visual that can be integrated on reports with other filters to loop through the selections. The chart also supports configurations for colour, showing and hiding different graphical markings and labels, and animation related controls. For examples and tips on usage please check the sample report.
ビジュアル機能
このビジュアルを使用すると次のことが可能です:
- 外部のサービスまたはリソースにアクセスできます
Wishyoulization のその他のアプリ
Tassels Parallel Sets SlicerWishyoulization Power BI visualsAn interactive parallel sets based visual slicer for exploring multi-categorical data.
Applicable to:Power BI visuals
NaN out of 2
Walkers Animated PictogramWishyoulizationPower BI visualsAn animated pictographic bar chart for building visually appealing reports.
Applicable to:Power BI visuals
NaN out of 2
本製品を取得することで、プロバイダーが本製品および関連製品に関して私に連絡できるように、私のアカウント情報を Microsoft が使用または共有することを許可します。プロバイダーの 使用条件 および プライバシー ポリシー に同意し、Microsoft がプロバイダーである場合を除き、本製品を使用する権利が Microsoft から提供されるものではないことを理解しました。AppSource の使用は、別の 使用条件 および プライバシー に基づいています。