Marimekko Chart - xViz
作成者: xViz LLC dba Lumel

Visualize data over a pair of categories & KPIs on actual/100% scale with advanced analytics!

📢 Marimekko Chart Evolved — Now Part of Analytics+!
Analytics+ is a next generation custom visual that combines 100+ advanced chart types - including Marimekko Chart - into a single, unified visual. It’s designed to elevate your data storytelling while helping you streamline and even retire additional tools like Tableau, Qlik, Spotfire and many more.
Why choose Analytics+?
- 🔥 100+ Charts in a single visual – Skip the pain of evaluating, licensing, administering and managing multiple visuals
- 🚫 Next-Gen Design Experiences – Rich and comprehensive design & run-time interactive experiences, driving easier insight discovery
- ✨ User-friendly Pricing – Analytics+ offers all the 100+ visuals starting $3/user/month. Or you can buy a single visual family (Marimekko chart) for unlimited users here.
👉 Explore Analytics+ (Certified) on Microsoft AppSource
➡️ Learn more about Marimekko Chart in Analytics+
📌All new purchases for this chart will be through Analytics+. Only existing customers will continue to be supported through xViz licensing.
Questions? Contact us here.
Marimekko chart is a 2D stacked chart, also known as a market map or mosaic chart. It can segment an industry or company by customer, segment, category, sub-category, region, or product, and makes it simple for end users to comprehend the relationship between each segment or bar to the total. A Marimekko chart can include multiple divisions in each bar, making it valuable for detecting market opportunities.
Key Feature Highlights:
- Chart Orientation – Switch between vertical and horizontal chart orientation
-
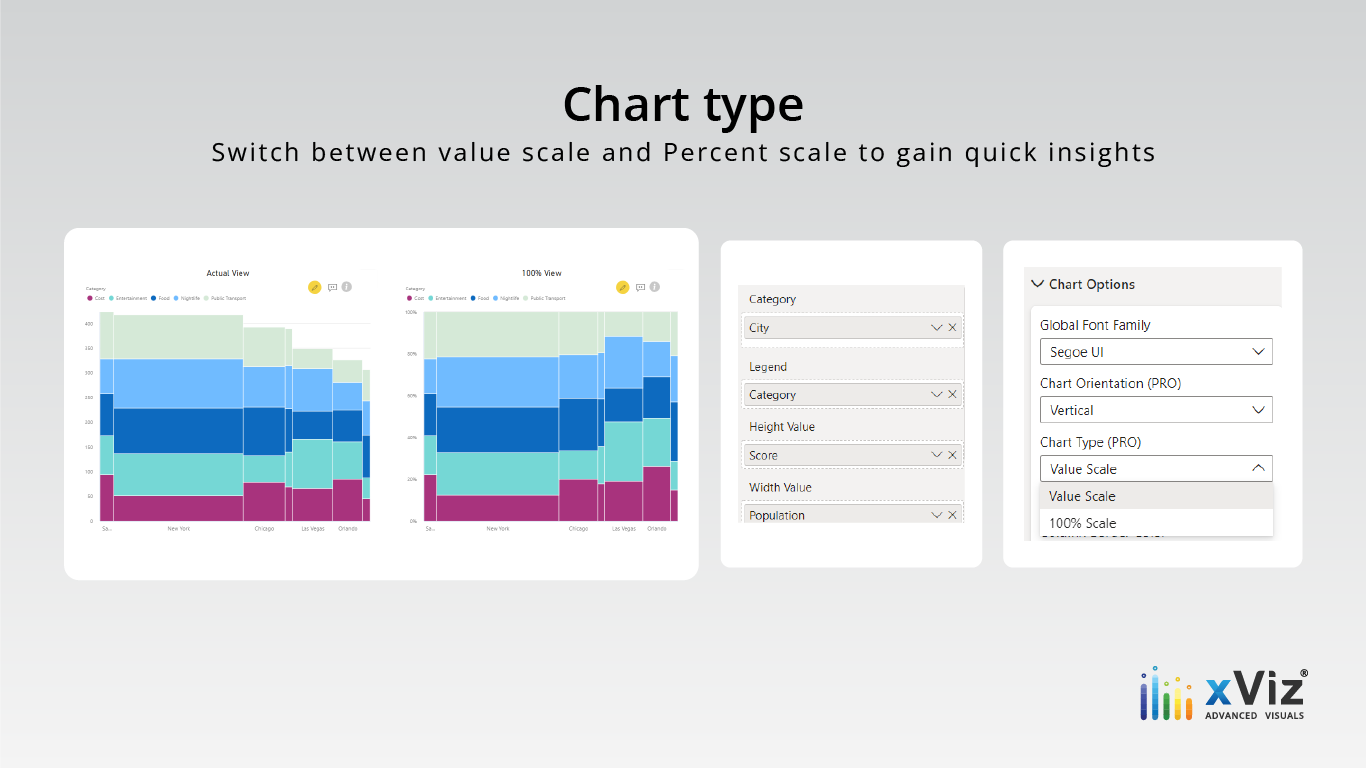
Chart Type – Actual and 100%
- Actual view – compare values across dimension
- 100% view – compare values with percent contribution
- Axis Labels – Customize to show category labels, actual values, or percentages
- Data Labels – Customize to show categories, actuals, Values, % values, or all together
- Column Total – Display column totals without DAX
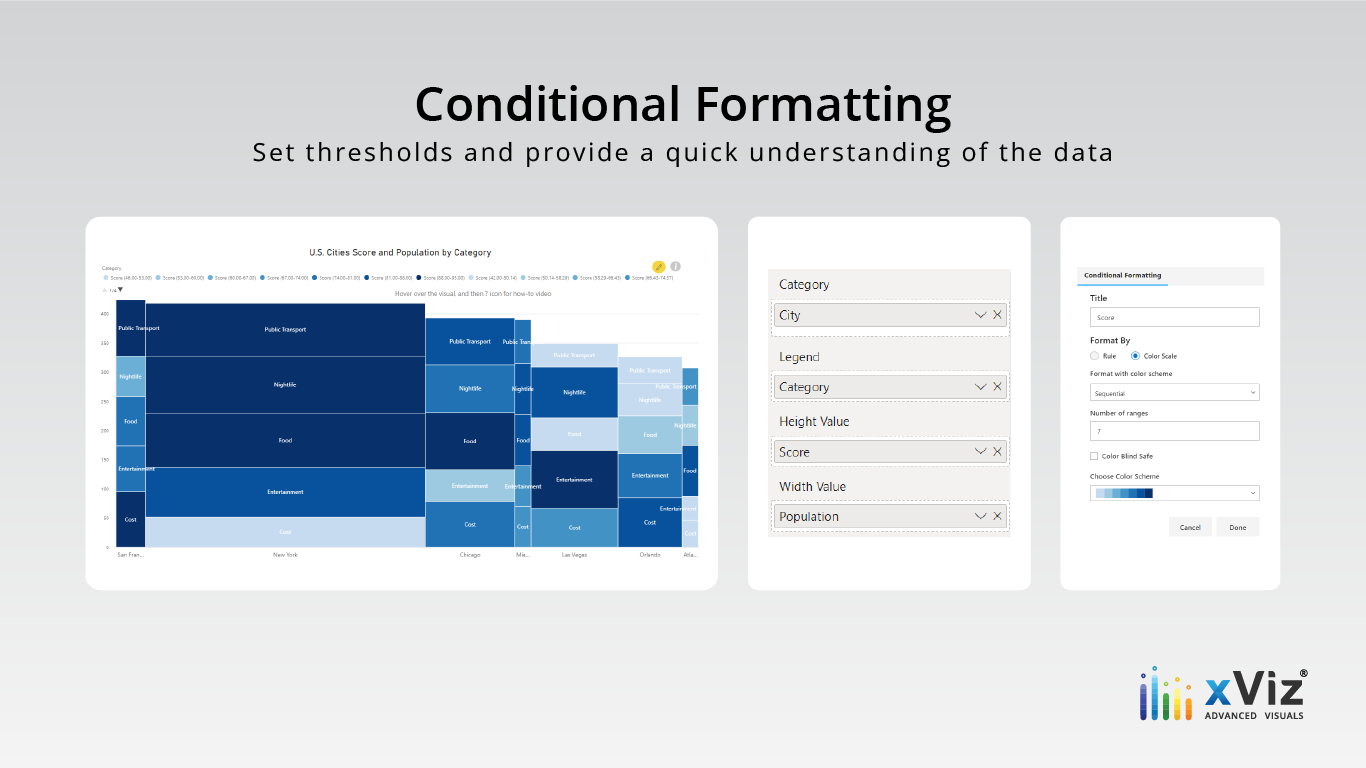
- Conditional Formatting – Highlight outliers based on set rules, to gain insights on your data
- Column Total – Display column totals without DAX
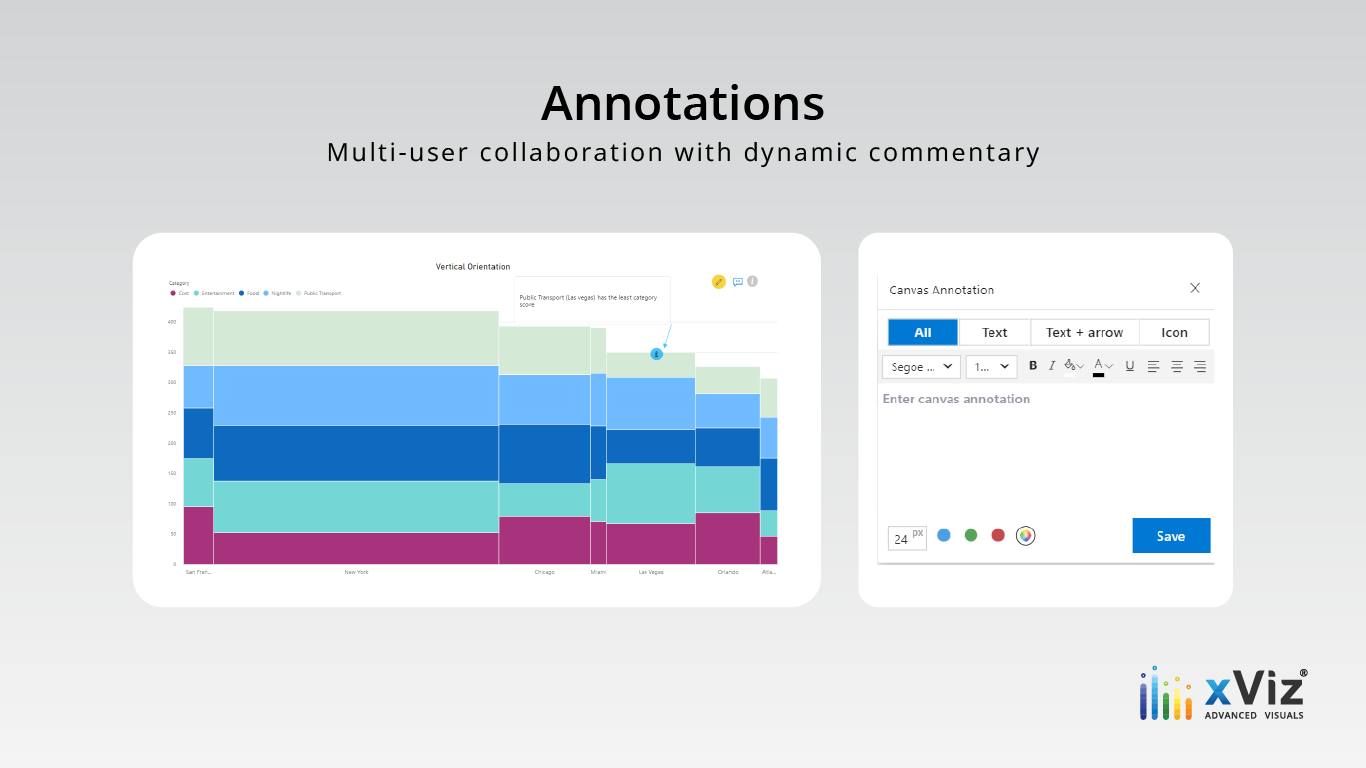
- Annotations – collaborate with other users with dynamic annotation/commenting. It also enables interactive storytelling by highlighting specific datapoints
- Summary Table – Gain a tabular overview to slice and filter your data
- Enable drill-down feature to better understand the levels of data hierarchy
ビジュアル機能
概要
xViz LLC dba Lumel のその他のアプリ
