Cennik Bezpłatnie

The Bing Maps add-in makes it easy to plot locations and visualize your data through Bing Maps in Excel
Bing Maps app for Office helps you use location data from a given column and plot it on a Bing Map. It also provides basic data visualization using your location data.
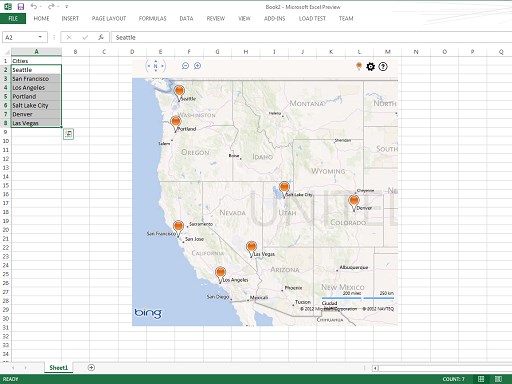
Plot: Once you launch the app from insert->app, you will see a default map embedded into your Excel spreadsheet. You can select locations from a column and click on the pin icon at the top right to plot them. The header for the column must be selected and the locations should be continuous valued below the header.
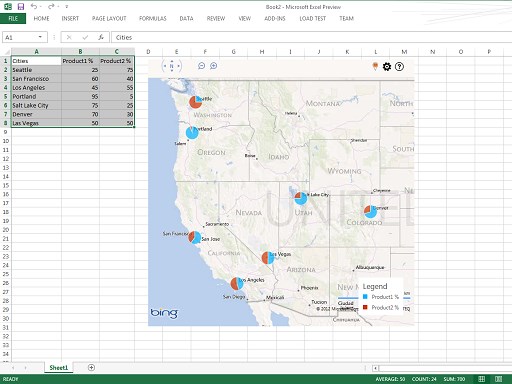
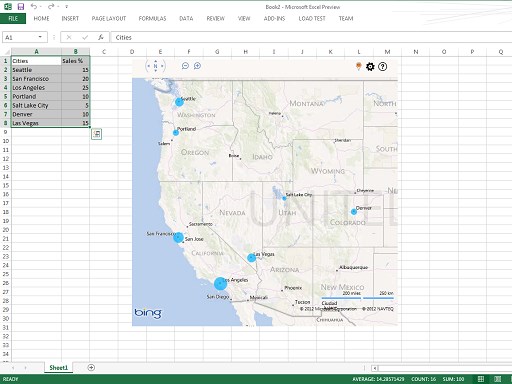
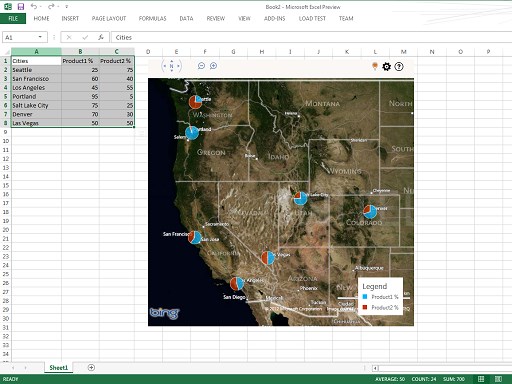
Data visualization: You can also select adjacent columns to the right of locations containing data that you want to visualize on the map. If cells from a single adjacent data column is selected, locations are plotted with different sized circles. If multiple data columns are selected, you have the option to either plot them as multiple circles or a pie chart. This can be controlled by clicking on settings icon on the top right.
Map Controls: You can use the map controls displayed on the top left to pan in a direction or to zoom in/out. Alternatively you can also zoom the map using your mouse or touch. Map view can be changed from settings to either road or birds eye.
Możliwości aplikacji
Gdy ta aplikacja jest używana,
- Może odczytywać i wprowadzać zmiany w dokumencie
- Może wysyłać dane przez Internet
W skrócie
Inne aplikacje z Microsoft Corporation
Microsoft Visio Data VisualizerMicrosoft Corporation ExcelQuickly and easily visualize your data into polished Visio diagrams within Excel.
Applicable to:Excel
NaN out of 5
WikipediaMicrosoft CorporationExcel WordFind and quote related information from Wikipedia.
Applicable to:ExcelWord
NaN out of 5
Microsoft Dynamics Office Add-inMicrosoft CorporationExcelWordThe Microsoft Dynamics Office Add-in enables data connections to Microsoft Dynamics systems.
Applicable to:ExcelWord
NaN out of 5
Translator for OutlookMicrosoft Corporation OutlookTranslator helps you read messages in your preferred language across devices.
Applicable to:Outlook
NaN out of 5
People GraphMicrosoft CorporationExcelTransform cold data into a cool picture.
Applicable to:Excel
NaN out of 5
Nabywając ten produkt udzielam firmie Microsoft pozwolenia na używanie lub udostępnianie informacji o moim koncie, aby dostawca mógł kontaktować się ze mną w sprawie tego produktu i produktów powiązanych. Akceptuję warunki użytkowania i zasady ochrony prywatności dostawcy oraz rozumiem, że prawa do korzystania z tego produktu nie pochodzą od firmy Microsoft, chyba że firma Microsoft jest jego dostawcą. Korzystanie z usługi AppSource podlega oddzielnym warunki i ochrona prywatności.