
Cennik Bezpłatnie

Multi KPI
firmy Microsoft Corporation
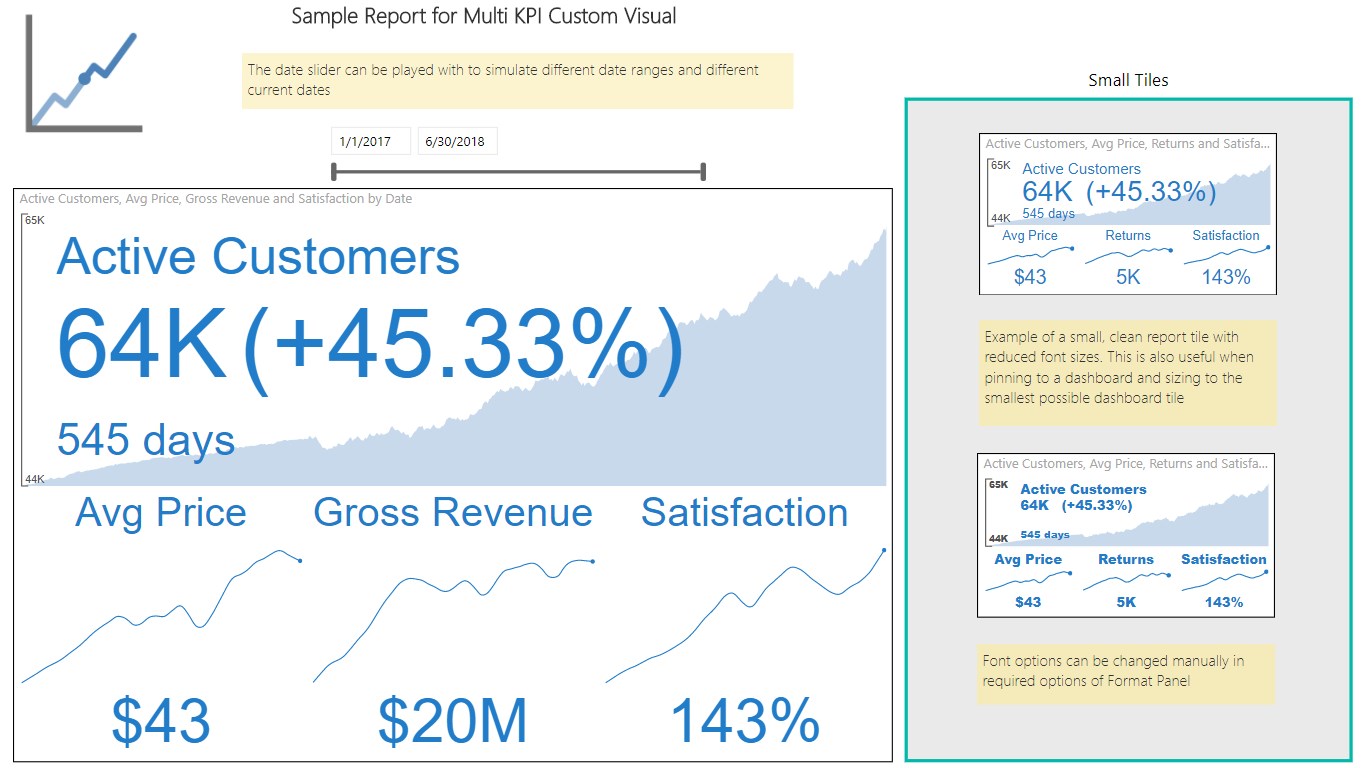
A powerful Multi KPI visualization, of a key KPI along with multiple sparklines of supporting data
The Multi KPI custom visual is for presenting a key performance indicator (KPI) along with a variety of supporting information, including:
- Title, Subtitle
- Sparklines
- Current date and KPI status (value, date, variance)
Some of the key features include:
- KPI trend over time: hover-over the main chart to see a KPI for each date.
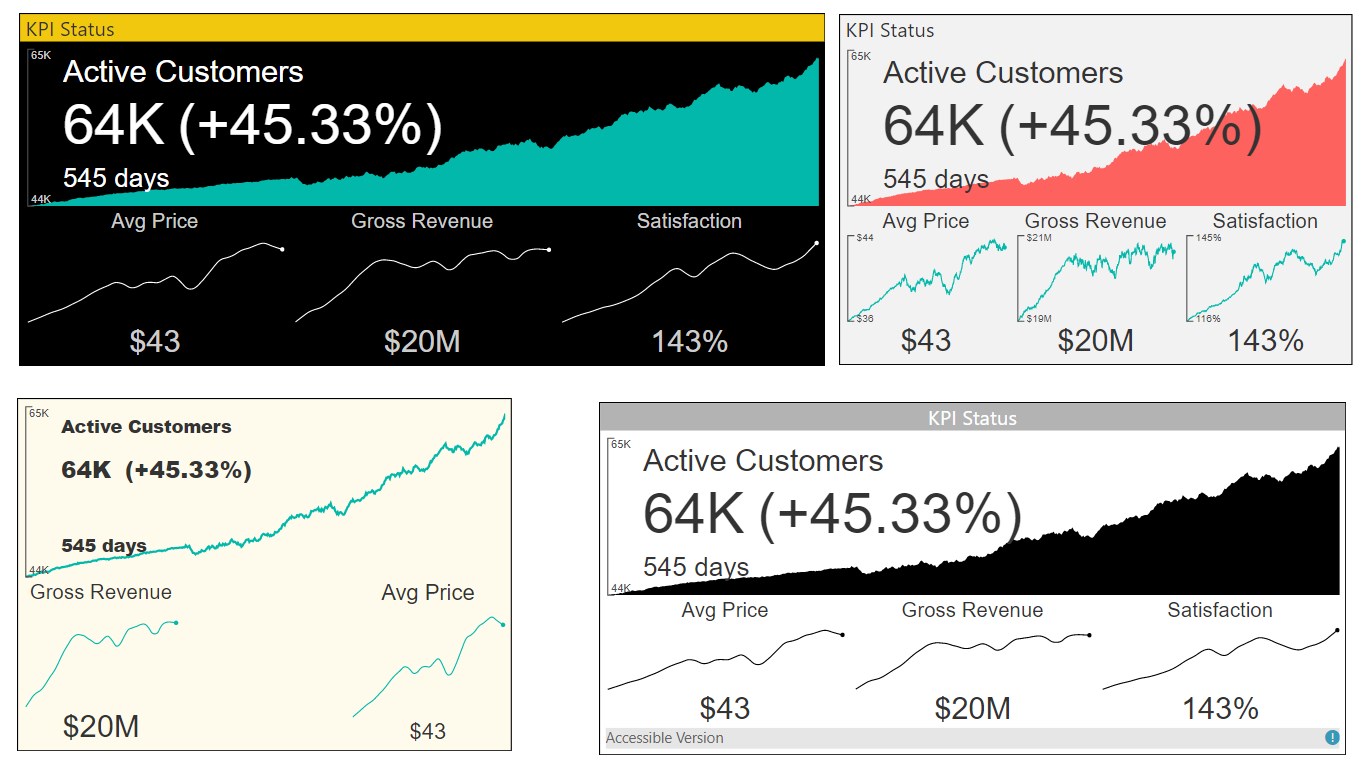
- Rich Formatting Options: set alternate titles, and tooltips, font sizes, colors, background colors.
- Numerous Chart Features: multi KPI support number types, precision, Y-axis tick marks, and hover-over tooltips.
- Sparkline Interpolation: Interpolate sparkline values to get rid of noisy points.
- Auto-Scaling: design a larger tile in your report with rich details. After pinning it to a Power BI Dashboard, you may resize it to smaller versions of the tile without losing essential details.
Download the sample Power BI Desktop file here: https://visuals.azureedge.net/app-store/MultiKpi.multiKpiEA8DA325489E436991F0E411F2D85FF3.1.0.0.0.pbix
Możliwości wizualizacji
Ta wizualizacja uzyskała certyfikat usługi Power BI
W skrócie
Inne aplikacje z Microsoft Corporation


Text FilterMicrosoft Corporation Power BI visualsSearch across your dataset right from the dashboard
Applicable to:Power BI visuals
NaN out of 5

Word CloudMicrosoft CorporationPower BI visualsCreate a fun visual from frequent text in your data
Applicable to:Power BI visuals
NaN out of 5

GanttMicrosoft CorporationPower BI visualsA type of bar chart which illustrates a project timeline or schedule with resources
Applicable to:Power BI visuals
NaN out of 5

Chiclet SlicerMicrosoft CorporationPower BI visualsDisplay image and/or text buttons that act as an in-canvas filter on other visuals
Applicable to:Power BI visuals
NaN out of 5

Sankey ChartMicrosoft CorporationPower BI visualsFlow diagram where the width of the series is proportional to the quantity of the flow
Applicable to:Power BI visuals
NaN out of 5
By getting this product, I give Microsoft permission to use or share my account information so that the provider can contact me regarding this product and related products. I agree to the provider's warunki użytkowania and zasady ochrony prywatności and understand that the rights to use this product do not come from Microsoft, unless Microsoft is the provider. Use of warunki is governed by separate ochrona prywatności and {4}.