Cene Morda boste morali kupiti dodatne izdelke

Fully customizable investing research and analysis tools
GuruFocus Tools provides a fully-customizable investing research and analysis add-in that allows users to pull up to 30 years of historical financial data on over 90,000 stocks from regions around the globe.
Users can also access several pre-built templates that output fundamental data and a wide range of metrics measuring financial strength, profitability, valuation, growth and momentum.
Download the templates below:
https://www.gurufocus.com/excel-add-in
Powerful GURUF function
The GURUF function works with common Excel functions like SUM, AVERAGE and COUNT that allow for deeper analysis on the data. One click refreshes the data, allowing users to retrieve GuruFocus data without leaving the Excel.
Examples:
=GURUF(“AAPL”,”Price”) gives Apple’s current price.
=GURUF(“AAPL”,”Revenue”,”-15”,”A”) gives Apple’s revenue over the past 15 years.
=GURUF(“AAPL”,”Net Income”,”2021”,”Q”) gives Apple’s net income for each quarter in 2021.
=GURUF(“AAPL”,”Total Assets”,”2010:2020”,”A”) gives Apple’s total assets for each year from 2010 to 2020.
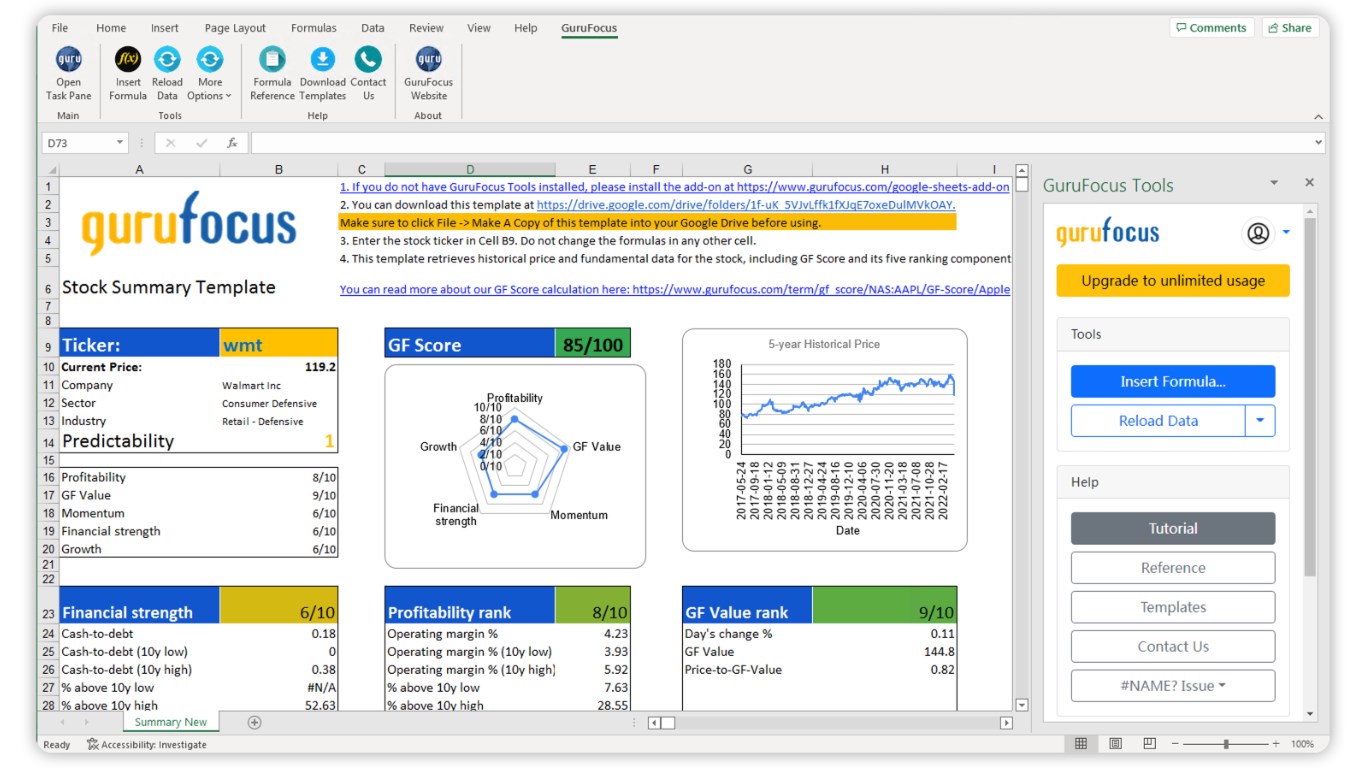
Stock Summary Template
GuruFocus Tools Stock Summary Template retrieves a snapshot of a company’s fundamental data, including the GF Score and its five ranking components: financial strength, profitability, growth, valuation and momentum.
30-year Historical Financials Data Template
GuruFocus Tools Historical Financial Data Template retrieves up to 30 years of historical per share data, ratios, income statement, balance sheet, cash flow statement, valuation ratios and quality metrics.
DCF Calculator Template
GuruFocus DCF Calculator Template gives a company’s intrinsic value based on a two-stage discount free cash flow or discount earnings model.
Zmogljivosti aplikacije
Ko je ta aplikacija v uporabi, lahko
- Bere vsebino dokumenta in ga spreminja
- Pošilja podatke prek interneta
Hiter pregled


Druge aplikacije s seznama Gurufocus. LLC
S pridobivanjem tega izdelka Microsoftu podeljujem dovoljenje za uporabo ali skupno rabo podatkov o mojem računu, tako da lahko ponudnik vzpostavi stik z mano glede tega izdelka in sorodnih izdelkov. Strinjam se z dokumentoma pogoji uporabe in pravilnik o zasebnosti ponudnika, ter se zavedam, da pravic za uporabo tega izdelka ne določa Microsoft, razen če je Microsoft ponudnik. Uporabo storitve AppSource urejata ločena dokumenta pogoji in zasebnost.
