
Priser Kostnadsfri

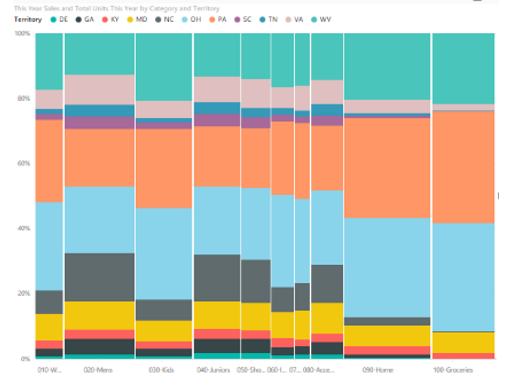
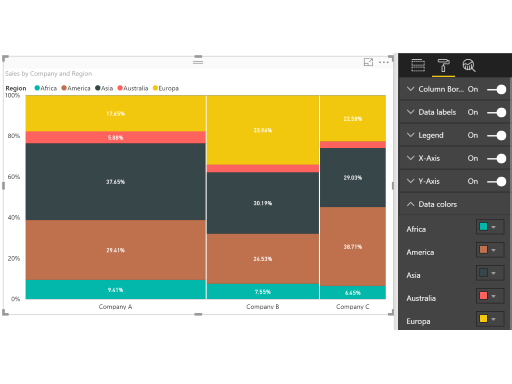
Mekko Chart
av Microsoft Corporation
A mix of 100% stacked column chart and 100% stacked bar chart combined into one view
Since it captures two dimensions in one chart, you can quickly spot the large segments as well the ones that are underrepresented in one quick glance. You can either use the same measure for the column height and width or use different ones depending on your need.
Similar to a treemap, the dimensional values are represented by the length and width of each rectangle. The width of a column is proportional to the total value of the column.
Segmentation and Pattern analysis are a big part of business analysis and with traditional charts you need to piece multiple individual items together in your mental map to draw conclusions. For dealing with such complex business analysis involving multiple variables/dimensions, the iconic marimekko design is very appealing and the Mekko chart makes it super easy to achieve this in Power BI.
The Mekko chart visual also allows you to control the legends, data colors, and data labels for a truly customized presentation.
Visuella funktioner
Den här visuella objektet har certifierats av Power BI
En snabbtitt

Andra appar från Microsoft Corporation


Text FilterMicrosoft Corporation Power BI visualsSearch across your dataset right from the dashboard
Applicable to:Power BI visuals
NaN out of 5

Word CloudMicrosoft CorporationPower BI visualsCreate a fun visual from frequent text in your data
Applicable to:Power BI visuals
NaN out of 5

GanttMicrosoft CorporationPower BI visualsA type of bar chart which illustrates a project timeline or schedule with resources
Applicable to:Power BI visuals
NaN out of 5

Chiclet SlicerMicrosoft CorporationPower BI visualsDisplay image and/or text buttons that act as an in-canvas filter on other visuals
Applicable to:Power BI visuals
NaN out of 5

Sankey ChartMicrosoft CorporationPower BI visualsFlow diagram where the width of the series is proportional to the quantity of the flow
Applicable to:Power BI visuals
NaN out of 5
Genom att skaffa den här produkten ger jag Microsoft tillåtelse att använda eller dela min kontoinformation så att leverantören kan kontakta mig om den här produkten och relaterade produkter. Jag godkänner leverantörens användningsvillkor och sekretesspolicy och är införstådd med att rättigheterna att använda den här produkten inte kommer från Microsoft, såvida inte Microsoft är leverantören. Användningen av AppSource regleras av separata villkor och sekretess.