筛选器
浏览应用
对优惠进行筛选和排序,优化结果。

RefWorks Citation ManagerClarivate WordAccess your references when writing for quick formatting of citations and bibliography.
Applicable to:Word
1 out of 60

Histogram Chart (Standard)PBIVizEdit.com Power BI visualsPlot the distribution of data along with bin size customization
Applicable to:Power BI visuals
2 out of 60


Play Axis (Dynamic Slicer)mprozilPower BI visualsWorking like a dynamic slicer, it animates your other power bi visuals without any user interaction.
Applicable to:Power BI visuals
3 out of 60

QR4OfficeMichael A. Zlatkovsky Excel
Excel PowerPointWordA first-of-its-kind QR-generator that integrates seamlessly into your Office documents.
Applicable to:ExcelPowerPointWord
4 out of 60

SunburstMicrosoft CorporationPower BI visualsMultilevel donut chart for effectively visualizing hierarchical data
Applicable to:Power BI visuals
5 out of 60

Tornado chartMicrosoft CorporationPower BI visualsComparing the relative importance of variables between two groups
Applicable to:Power BI visuals
6 out of 60

Bullet ChartMicrosoft CorporationPower BI visualsA bar chart with extra visual elements to provide additional context. Useful for tracking goals
Applicable to:Power BI visuals
7 out of 60

Asana for OutlookAsana OutlookTurn emails into trackable, actionable work with Asana for Outlook.
Applicable to:Outlook
8 out of 60

Microsoft Visio Data VisualizerMicrosoft CorporationExcelQuickly and easily visualize your data into polished Visio diagrams within Excel.
Applicable to:Excel
9 out of 60

Map by SquillionSquillion Technology Private LimitedPower BI visualsElevate your data storytelling with engaging maps that highlight key insights
Applicable to:Power BI visuals
10 out of 60


Document CustomizerAbakion Business CentralCustomize, layout and translate 26 documents in only minutes. Report designer + Template report pack
Applicable to:Business Central
11 out of 60

WritefullWritefull BVWordWritefull is automated proofreading for science.
Applicable to:Word
12 out of 60

Card with States by OKVIZOKVIZ Corp.Power BI visualsCombines metrics, states, KPIs, and a trend line. Multiple cards available
Applicable to:Power BI visuals
13 out of 60


Adobe Acrobat for Microsoft Teams and OutlookADOBE INC. Office appOutlook
 TeamsGain insights, edit, convert, and collaborate on PDFs
查看包选项
Applicable to:Office appOutlookTeams
14 out of 60
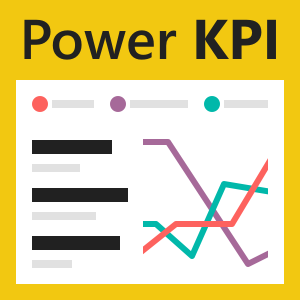
Power KPIMicrosoft CorporationPower BI visualsA powerful KPI Indicator with multi-line chart and labels for current date, value and variances.
Applicable to:Power BI visuals
15 out of 60

Calendly for OutlookCalendlyOutlookEliminate the back-and-forth of scheduling with one-click access to Calendly from your inbox.
Applicable to:Outlook
16 out of 60

Easy Code FormatterArman HilmiogluWordFormat your selected text like code. Choose from multiple open sourced code themes.
Applicable to:Word
17 out of 60

Microsoft Dynamics Office Add-inMicrosoft CorporationExcelWordThe Microsoft Dynamics Office Add-in enables data connections to Microsoft Dynamics systems.
Applicable to:ExcelWord
18 out of 60

Slack for OutlookSlack TechnologiesOutlookSend emails into Slack
Applicable to:Outlook
19 out of 60

Table HeatmapMicrosoft CorporationPower BI visualsCompare data easily and intuitively using colors in a table
Applicable to:Power BI visuals
20 out of 60
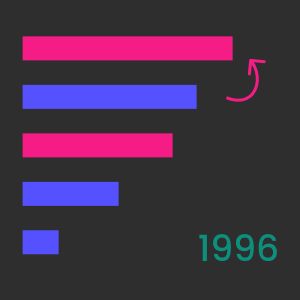
Animated Bar Chart RaceWishyoulizationPower BI visualsCreate fascinating animated trend charts, with bars that race to the top based on ranks.
Applicable to:Power BI visuals
21 out of 60

ChartExpo™ for Excelpolyvista.comExcelSelect a chart, select your data, and create Insightful charts without hardwork!
Applicable to:Excel
22 out of 60

Formula Bot | AI in SpreadsheetsFormula Bot (Datasetmatch LLC)ExcelRevolutionize your analytics workflow, from formula generation to data automation.
Applicable to:Excel
23 out of 60

Translator for OutlookMicrosoft CorporationOutlookTranslator helps you read messages in your preferred language across devices.
Applicable to:Outlook
24 out of 60
Gantt TimelinePowerGraphPower BI visualsVisualize work plans with the PowerGraph Timeline: timeline & baseline bars, milestone icons
Applicable to:Power BI visuals
25 out of 60
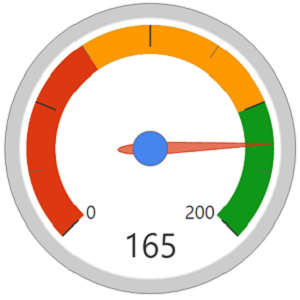
Dial GaugeCloudFronts TechnologiesPower BI visualsDial Gauge allows you to define various ranges in the dial along with pointer value.
Applicable to:Power BI visuals
26 out of 60

Mailtrack for Outlook by MailsuiteMailtrack.ioOutlookEmail tracker for Outlook. Free and unlimited email tracking.
Applicable to:Outlook
27 out of 60

Cisco Webex SchedulerCisco WebexOutlookSchedule, start, and join Cisco Webex meetings and Personal Room meetings.
Applicable to:Outlook
28 out of 60

SlidesAI For PowerPointZesterv FZE LLCPowerPointBest ChatGPT for PowerPoint. Text to PowerPoint in seconds with our AI PPT Maker. TRY FOR FREE!
Applicable to:PowerPoint
29 out of 60

Master Data InformationAbakionBusiness CentralThe simple way to create custom fields and do master data management and PIM without customization
Applicable to:Business Central
30 out of 60

WorkdayWorkdayTeamsAdd Workday to Microsoft Teams to enable a friction-free HR and Finance experience
查看包选项
Applicable to:Teams
31 out of 60
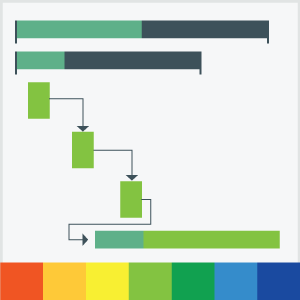
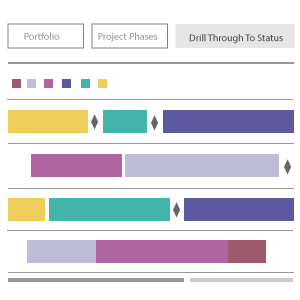
Gantt Chart - xVizxViz LLC dba LumelPower BI visualsProject management chart to monitor timeline, tasks, roadmaps, milestones, dependencies, resources!
Applicable to:Power BI visuals
32 out of 60

BookingsMicrosoft CorporationOffice appOutlookTeamsA simpler way to organize schedules and manage appointments.
Applicable to:Office appOutlookTeams
33 out of 60

Smart Filter by OKVIZOKVIZ Corp.Power BI visualsAn advanced slicer for your Power BI reports.
Applicable to:Power BI visuals
34 out of 60

Jira Cloud for ExcelAtlassian.comExcelExport Jira data to Excel - Combine the power of Jira with the flexibility of Excel
Applicable to:Excel
35 out of 60

AutopilotSmart Barn TechnologiesExcelPowerPointWordFREE GPT for Word, Excel and PowerPoint that is better than Copilot
Applicable to:ExcelPowerPointWord
36 out of 60
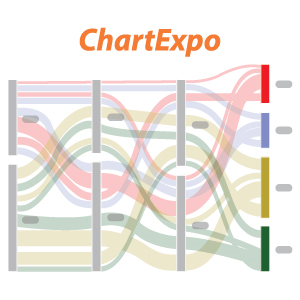
Sankey Diagram for Power BI by ChartExpopolyvista.comPower BI visualsFind out why 430,000+ users love ChartExpo. Experience the ChartExpo Sankey Diagram Difference.
Applicable to:Power BI visuals
37 out of 60

AhaSlides - Live Polls & QuizzesAhaSlidesPowerPointAhaSlides - The Power of Engagement!
Applicable to:PowerPoint
38 out of 60

Zebra BI ChartsZebra BIPower BI visualsOne visual, many charts. Waterfall, variance, column, area, line, dot, combo… in small multiples!
Applicable to:Power BI visuals
39 out of 60

Bubble / Scatter Chart - xVizxViz LLCPower BI visualsUse Advanced Analytics for Correlation Analysis: Alerting, Trend Lines, Ranking & More!
Applicable to:Power BI visuals
40 out of 60

Enlighten AquariumENLIGHTEN DESIGNSPower BI visualsMake dashboards fun with this award-winning Aquarium visualization
Applicable to:Power BI visuals
41 out of 60

Culture Cloud by O.C. TannerO.C.TannerTeamsSend eCards and give nominations with points
Applicable to:Teams
42 out of 60
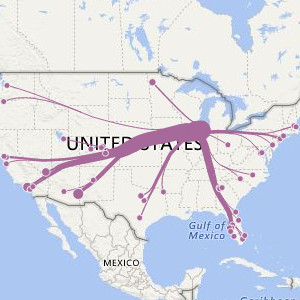
Flow mapWeiwei CuiPower BI visualsFlow-style visualization that depicts movements of objects among geo-locations
Applicable to:Power BI visuals
43 out of 60

Achievers for OutlookAchieversOutlookRecognize your colleagues right from Outlook!
Applicable to:Outlook
44 out of 60

WikipediaMicrosoft CorporationExcelWordFind and quote related information from Wikipedia.
Applicable to:ExcelWord
45 out of 60

Pareto by sio2Graphssio2GraphsPower BI visualsClearly visualize which factors are having the greatest impact and driving business processes.
Applicable to:Power BI visuals
46 out of 60

Trello for TeamsAtlassian.comOffice appOutlookTeamsTrello for Microsoft lets you work more collaboratively and get more done.
Applicable to:Office appOutlookTeams
47 out of 60

ClickUp for OutlookClickUpOutlookQuickly turn Outlook emails into tasks on the #1 rated productivity platform.
Applicable to:Outlook
48 out of 60

Finance agents in Microsoft 365 Excel (Preview)Microsoft CorporationExcelFinance agents in Microsoft 365 Excel is the next-generation AI assistant for finance professionals.
Applicable to:Excel
49 out of 60

ShareFileProgress Software CorporationOutlookSecurely share, receive, and save files using ShareFile integration in Outlook.
Applicable to:Outlook
50 out of 60

Data Access - API data integrationAbakionBusiness CentralManaged API integration for Business Central - to connect Power BI or any third-party solution
Applicable to:Business Central
51 out of 60

Exclaimer Cloud for OutlookExclaimer LimitedOutlookOutlook Add-In: Create and centrally manage professional email signatures for all users on M365
Applicable to:Outlook
52 out of 60
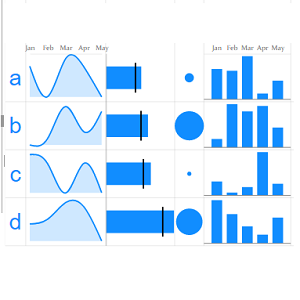
Multiple SparklinesExcelnaccess.comPower BI visualsTransform your Table Data/ Numbers into Charts for stunning visual insights
Applicable to:Power BI visuals
53 out of 60
Radar/Polar Chart - xVizxViz LLCPower BI visuals360-degree data comparison with 10+ series types, 10+ chart configurations, and advanced formatting
Applicable to:Power BI visuals
54 out of 60

Bullet Chart by OKVIZOKVIZ Corp.Power BI visualsShowcase performance vs. targets with precision using the best Bullet Chart for Power BI!
Applicable to:Power BI visuals
55 out of 60

Simple WaterfallDATANOMY TECHNOLOGIES LIMITEDPower BI visualsDefine waterfall pillars | Advance Formatting | Fully customisable | Drillable |
Applicable to:Power BI visuals
56 out of 60

QuillBotKeuji CoWordSave time and immediately improve your writing with QuillBot’s Paraphrasing and Summarizing Tool.
Applicable to:Word
57 out of 60

HeyGenSurreal Technology Inc. SaaSThe best AI video generation platform for your team
Applicable to:SaaS
58 out of 60

Timer for PowerPoint1990quebec.comPowerPointA customizable timer for PowerPoint slides, helping speakers manage their time with a live timer.
Applicable to:PowerPoint
59 out of 60

SysTools OST to PST ConverterSYSTOOLS SOFTWARE PRIVATE LIMITEDSaaSTool to Convert OST to PST, MBOX, MSG, EML, EMLX, NSF, MHT, DOCX, DOC, CSV, PDF, TXT, HTML Formats
+包含的加载项
Applicable to:SaaS
60 out of 60