Datawrapper: Charts, Maps, and Tables
作者 Datawrapper GmbH
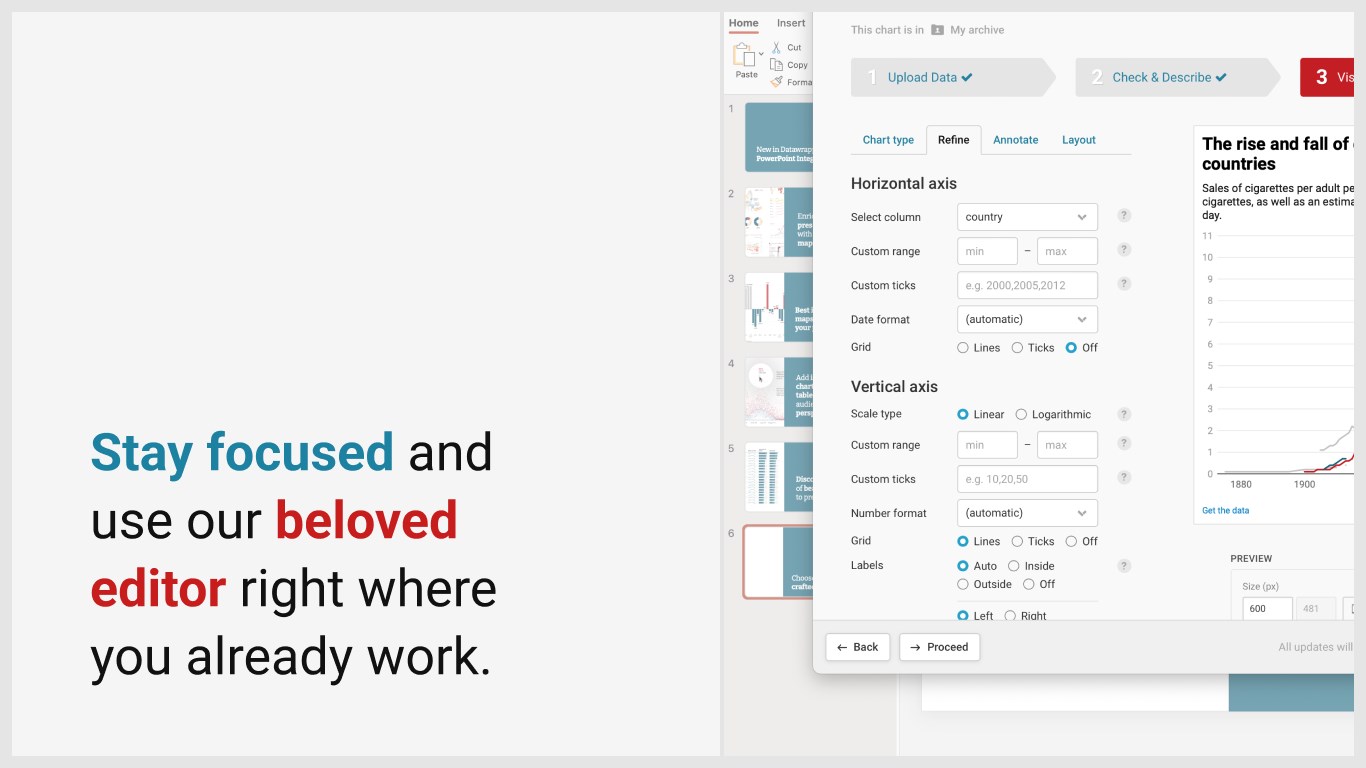
Enrich your slides with powerful data visualizations. Create and edit them directly in PowerPoint.
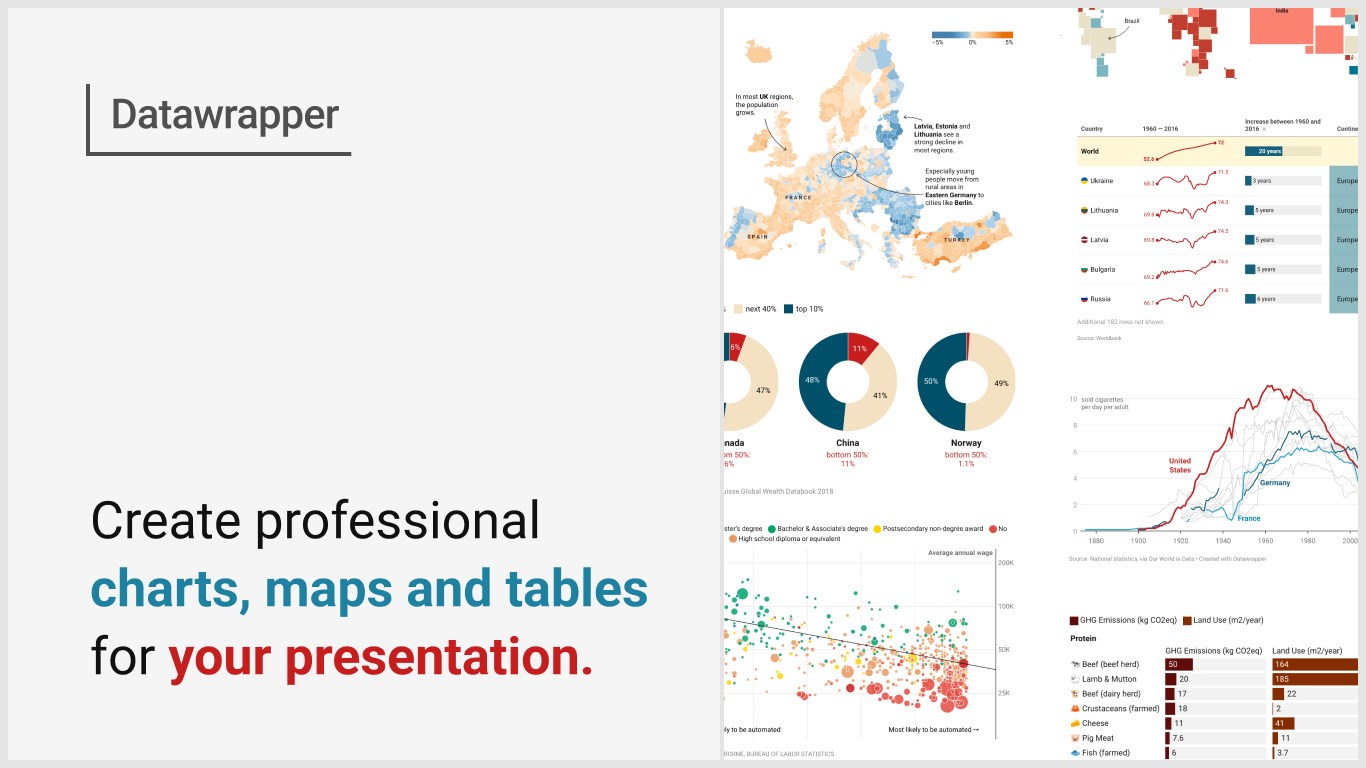
Create beautiful data visualizations with the help of Datawrapper — no code or design skills required. In only a few simple steps you can get from your raw data to stunning charts, maps, or tables.
The add-in allows you to create and edit visualizations without leaving PowerPoint.
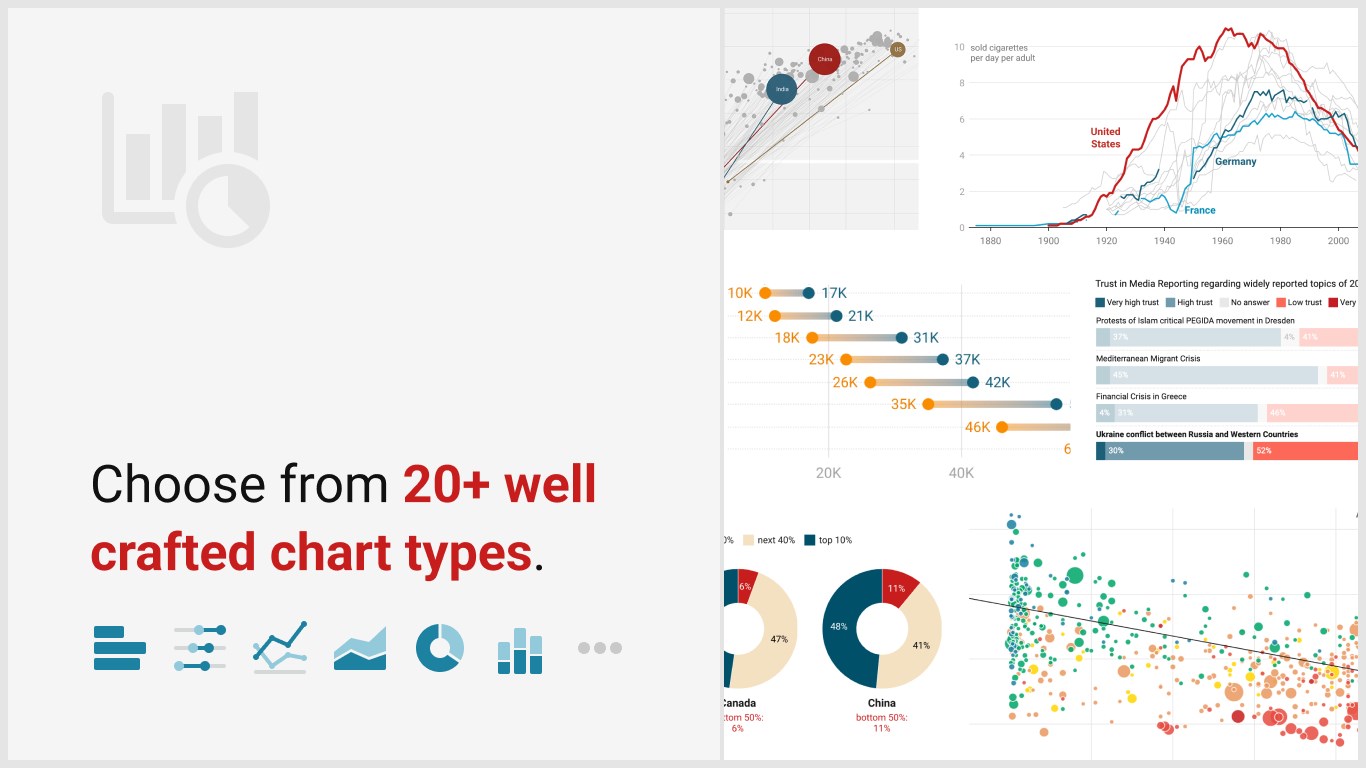
Charts
Use one of 20+ interactive and responsive chart types, from simple bars and lines to arrow, range, and scatter plots.
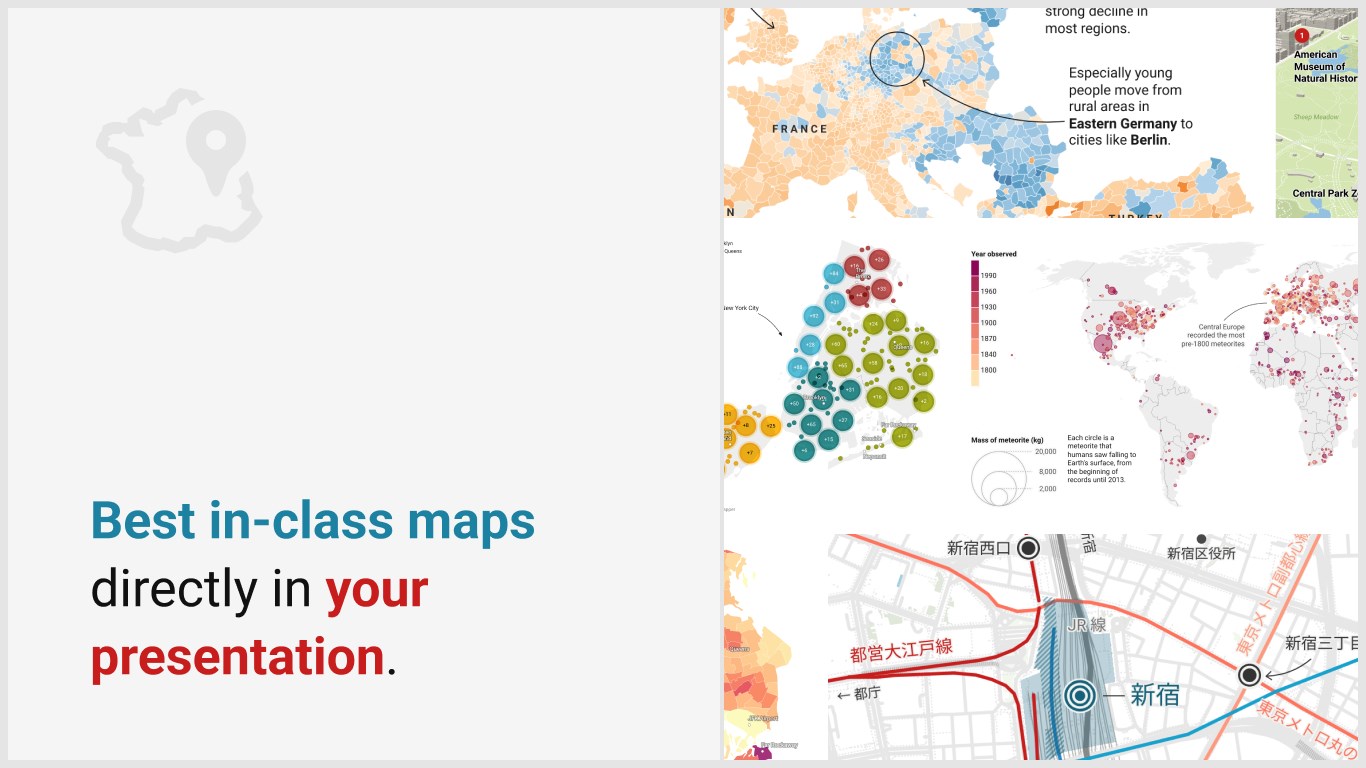
Maps
Three interactive and responsive map types let you create anything from locator maps to thematic choropleth and symbol maps.
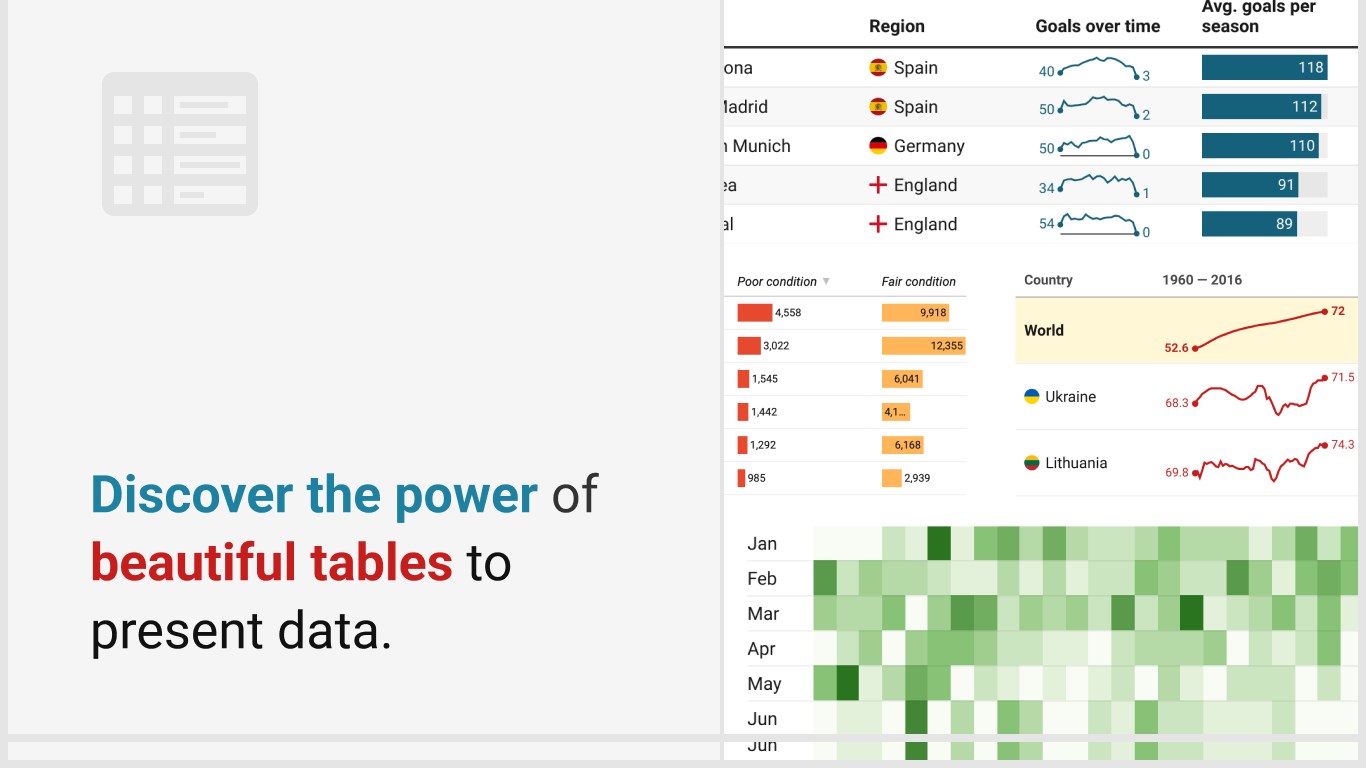
Tables
Responsive data tables with lots of styling options let you include bar, column, and line charts, heatmaps, images, a search bar, and pagination.
Outside of PowerPoint
All of your visualizations are linked to your Datawrapper account and can therefore also be used outside of PowerPoint.
Interactivity
To add interactive Datawrapper visualizations, install the add-in called “Interactive Visualizations with Datawrapper.”
Using Datawrapper requires a free account.
應用程式功能
- 可以讀取及變更您的文件
- 可以在網際網路上傳送資料
概覽