Preise Free
China Heat Map
durch 北京上北智信科技有限公司
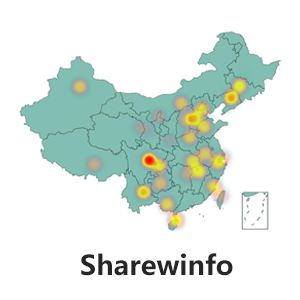
The China heat map of sharewinfo is a product that uses different color blocks superimposed on
Designed for the Chinese geographical data, thermal maps can be classified by region of the data displayed on the map, through different colors to render the analysis of the area distribution of objects, and can adjust the display of color intensity and blur degree. The larger the amount of data, the darker the color of the display block.
Users can get a glimpse of the map's thermal efforts, but also through latitude data, for the city, and even around the country a subject (such as the weather) of the heat can be mastered.
Characteristics
****Support Offline map
This allows you to do not need to open each time online load map information, greatly enhance the production and reading report efficiency, so that interactive operation more smooth and smooth.
****Support a key switch between map and provincial map in China
You can select the type of map in a single key in a configuration item, whether it is a national map or any province, and can be easily displayed.
****Rich Visual Configuration Items
• Support arbitrary settings want to show in the middle of the map latitude and longitude, so that readers at a glance;
• Supports the configuration of color gradient range, the map will automatically according to the size of the number of color classification;
• Support for setting title, legend, text attributes, highlight areas, and color of data points, and so on.
Visuelle Funktionen
Hinweise für die Verwendung dieses Visuals:
- Zugriff auf externe Dienste oder Ressourcen möglich
Andere Apps aus 北京上北智信科技有限公司
Organization Chart北京上北智信科技有限公司 Power BI visualsA standardized structure diagram generation control.
Applicable to:Power BI visuals
NaN out of 5
Power Slicer北京上北智信科技有限公司Power BI visualsMulti-dimensional slices have been added and support for default dynamics
Applicable to:Power BI visuals
NaN out of 5
China Flow Map北京上北智信科技有限公司Power BI visualsThe flow map helps to show the geographical distribution of the migration activities。
Applicable to:Power BI visuals
NaN out of 5
DataText Box北京上北智信科技有限公司Power BI visualsApply to data labels, summary reports, data templates, and so on, once and for all, speed up data tr
Applicable to:Power BI visuals
NaN out of 5
China Color Map北京上北智信科技有限公司Power BI visualsFor the Chinese market, the configurable items of China Maps are more plentiful and can be switched
Applicable to:Power BI visuals
NaN out of 5
Durch das Abrufen dieses Produkts erlaube ich Microsoft die Verwendung oder Freigabe meiner Kontoinformationen, damit der Anbieter mich bezüglich dieses Produkts und verwandter Produkte kontaktieren kann. Ich stimme den Nutzungsbedingungen und Datenschutzrichtlinie des Anbieters zu und verstehe, dass die Rechte zur Verwendung dieses Produkts nicht von Microsoft stammen, es sei denn, Microsoft ist der Anbieter. Die Verwendung von AppSource wird durch separate Geschäftsbedingungen und Datenschutz gesteuert.