
Status Tracker
by Viz Data Ltd

Beautiful visual, comparing status across your categories with traffic light system
Make your reports highly functional with a set of visual slicers that use dynamic circles
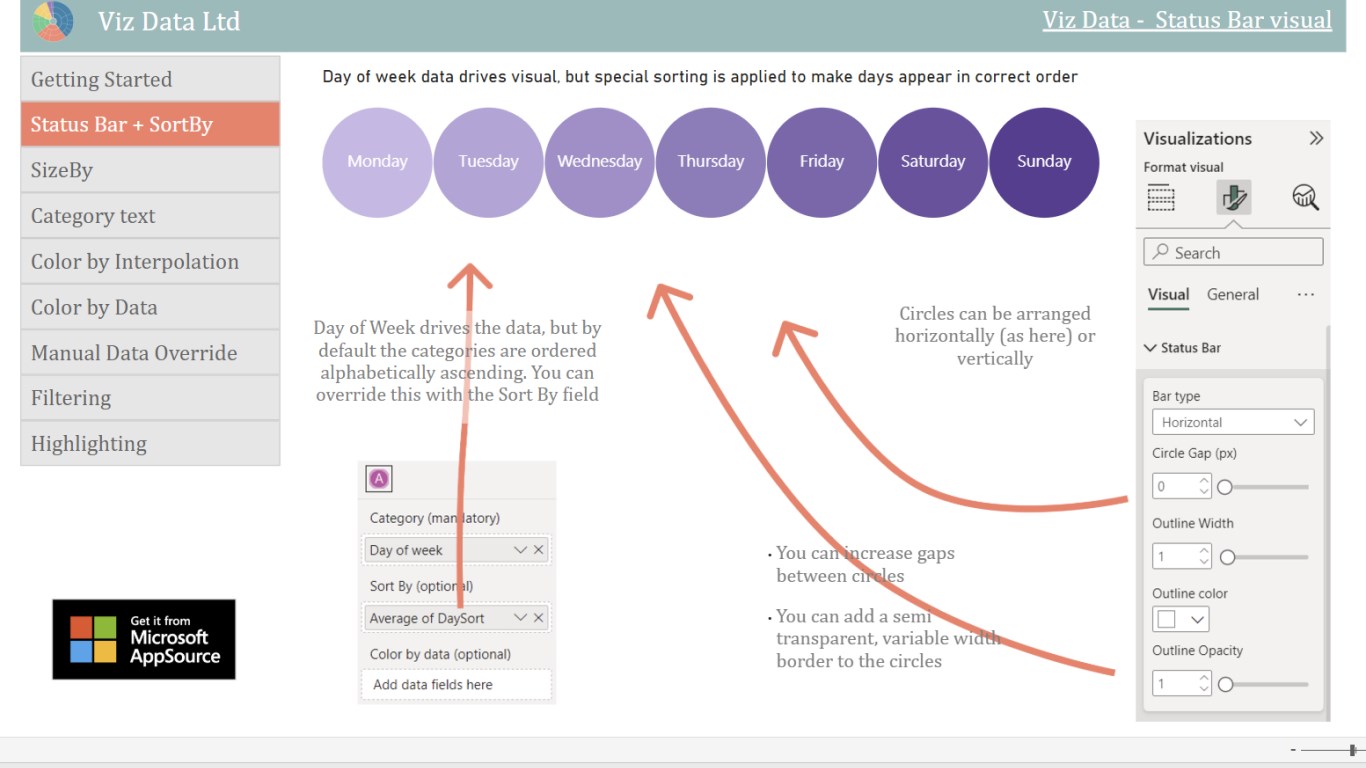
Status Bar is an attractive and intuitive way to visualize and filter category data in your Power BI reports. Status Bar represents your categories as a set of highly customisable circles. The size, sort and color of each circle can be data-driven, helping users recognise key values and filter with ease.
Why choose Viz Data for Power BI?
We design beautiful and highly functional custom visuals that seamlessly blend into your Power BI reports while maintaining the polish of PowerPoint and modern web design. We intend them to be easier to use than standard visuals.
Key Features and Benefits
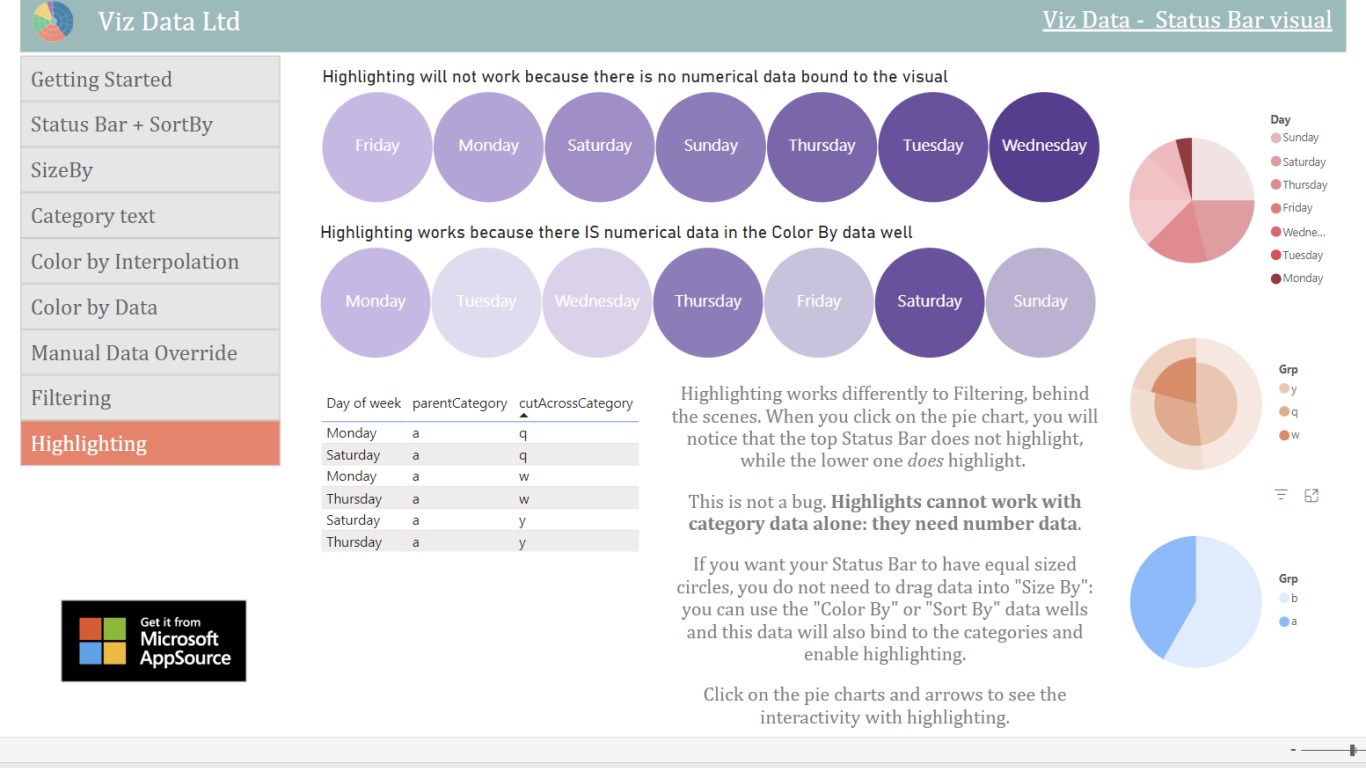
- ⚡ Clear and Intuitive Filtering: Filter or highlight category data by clicking on the circles. Use Edit Interactions to set the click behaviour you want, as with standard visuals. Ctrl+Click supported.
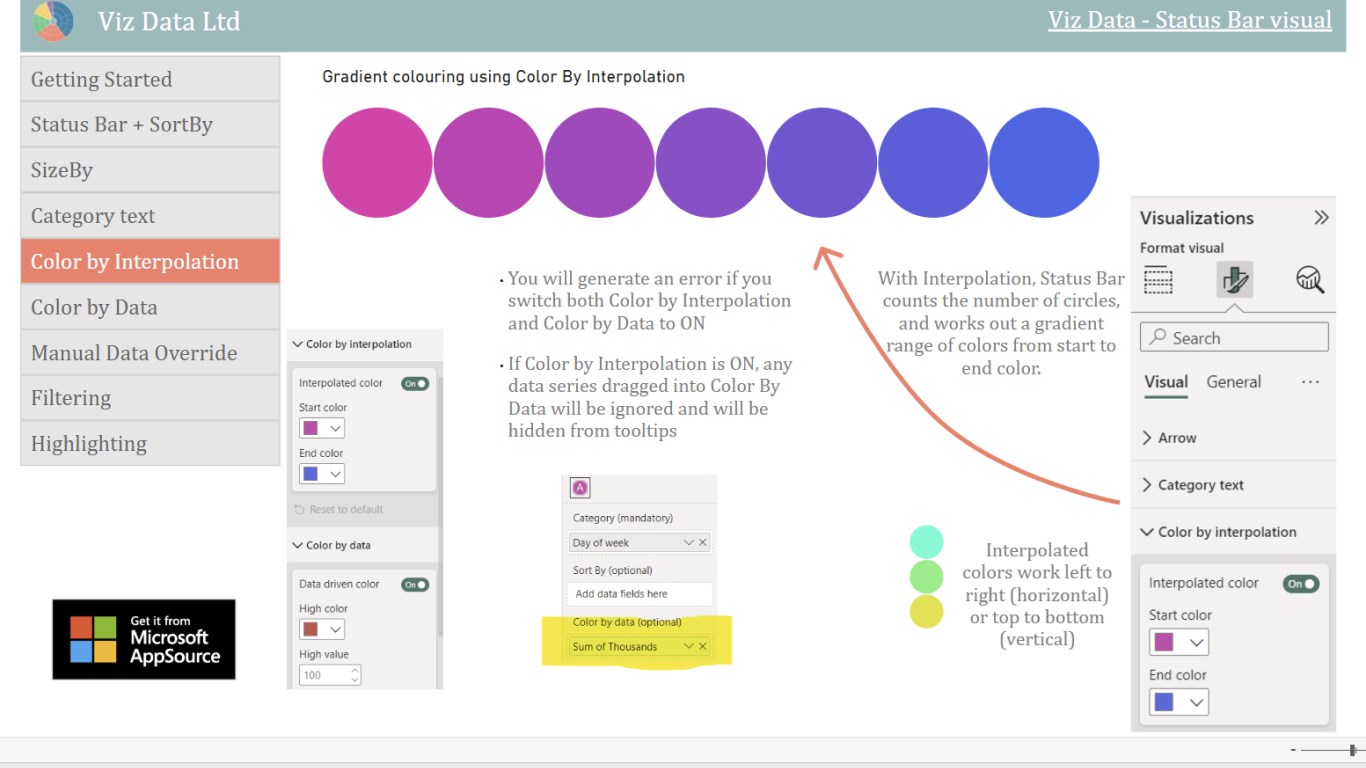
- ⚡ Customize easily: Edit circle size, color and layout with data-driven heatmap coloring, gradients, or solid colors.
- ⚡ Horizontal or vertical: Use Status Bar as a vertical "traffic light" visual, or make it span the width of your report for greater impact.
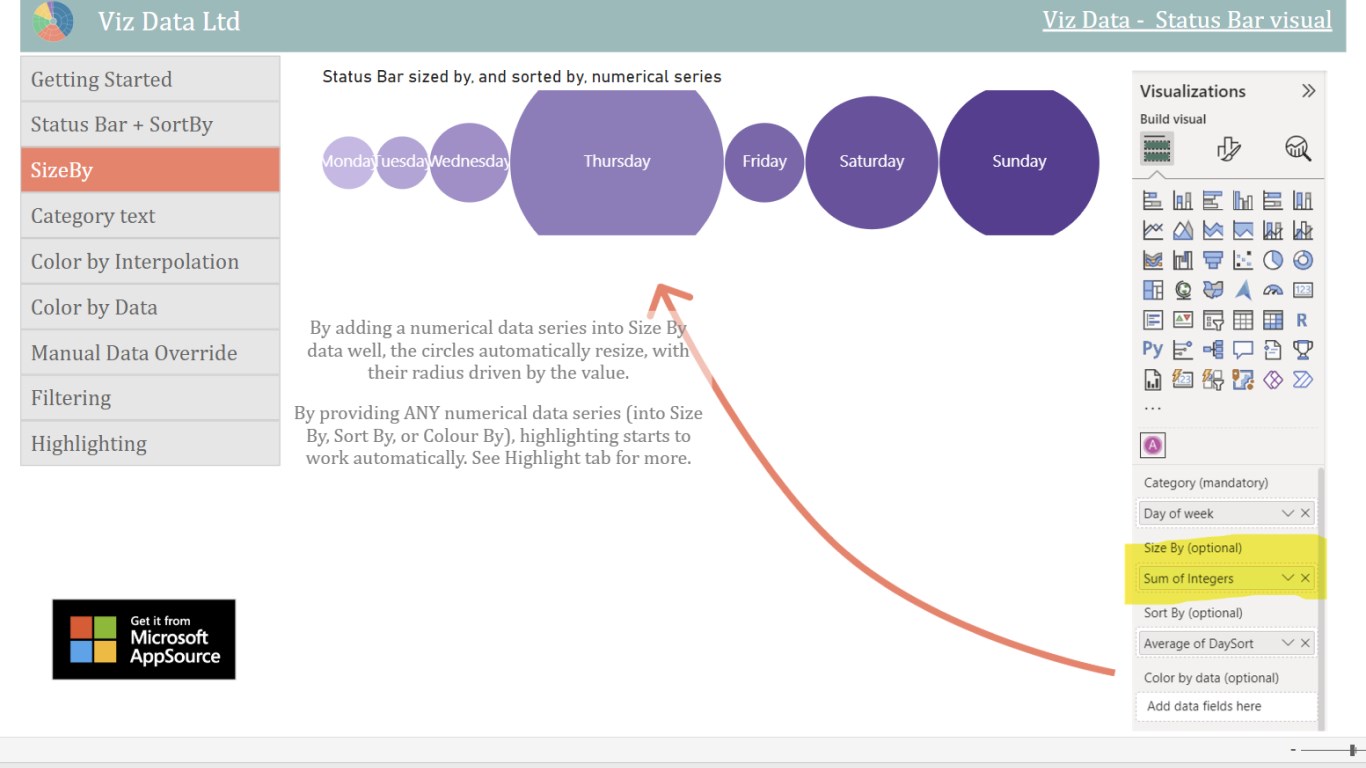
- ⚡ Data-Driven Sizing: The radius of each circle can dynamically adjust based on a numerical data series.
- ⚡ Data-Driven Sorting: Sort categories alphabetically, numerically, or by a custom data series.
- ⚡ Works in unsupported environments: License checks are skipped where user identity cannot be verified (e.g., Publish to Web), ensuring broad accessibility.
How to test and buy
- ✅ Try it now: Check out our interactive demo
- 📥 Download sample: Get a
.pbixfile with Status Bar examples. Edit for free in Power BI Desktop or Service, but viewers will need a license. - 🆓 Install for free: Download the
.pbivizfile and upload it into Power BI via the three dots in the Visual pane → Import from File. - 💳 Subscribe: Click Buy Now for a 1-month free trial. Subscriptions are handled only through Microsoft—Viz Data Ltd does not sell direct.
- 🔍 Learn more: Visit the product page
Visual capabilities
This visual is certified by Power BI
At a glance

Other apps from Viz Data Ltd


Filter BarViz Data Ltd Power BI visualsA compact visual filter that replaces standard slicers with coloured rectangular bars
Applicable to:Power BI visuals
NaN out of 5

Metro MapViz Data LtdPower BI visualsTransform complex distribution steps into a clear, metro-style map that can help reveal bottlenecks
Applicable to:Power BI visuals
NaN out of 5

DividersViz Data LtdPower BI visualsInteractive, space-saving category filters for Power BI—styled as sleek, data-driven tabs.
Applicable to:Power BI visuals
NaN out of 5

Process Flow DiagramViz Data LtdPower BI visualsProcess Flow Diagram is a stylish Power BI custom visual that makes your reports stand out
Applicable to:Power BI visuals
NaN out of 5

MetricViz Data LtdPower BI visualsStylish visual that reduces a series to a single value, using intelligent notation for large values
Applicable to:Power BI visuals
NaN out of 5