
Pricing Free

Stream Graph
by Microsoft Corporation
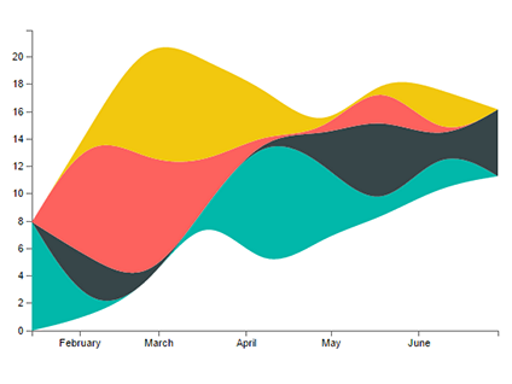
A stacked area chart with smooth interpolation. Often used to display values over time
A stream graph, is a type of stacked area graph which is displaced around a central axis, resulting in a flowing, organic shape.
Stream graphs display the changes in data over time of different categories through the use of flowing, organic shapes that somewhat resemble a river-like stream. This makes Stream Graphs aesthetically pleasing and more engaging to look at.
In a Stream graph, the size of each individual stream shape is proportional to the values in each category. The axis that a Stream Graph flows parallel to, is used for the time scale.
Stream graphs are ideal for displaying high-volume datasets, in-order to discover trends and patterns over time across a wide range of categories.
This is an open source visual. Get the code from GitHub: https://github.com/Microsoft/powerbi-visuals-streamgraph
Visual capabilities
This visual is certified by Power BI
At a glance
Other apps from Microsoft Corporation

Text FilterMicrosoft Corporation Power BI visualsSearch across your dataset right from the dashboard
Applicable to:Power BI visuals
NaN out of 5
Word CloudMicrosoft CorporationPower BI visualsCreate a fun visual from frequent text in your data
Applicable to:Power BI visuals
NaN out of 5
GanttMicrosoft CorporationPower BI visualsA type of bar chart which illustrates a project timeline or schedule with resources
Applicable to:Power BI visuals
NaN out of 5
Chiclet SlicerMicrosoft CorporationPower BI visualsDisplay image and/or text buttons that act as an in-canvas filter on other visuals
Applicable to:Power BI visuals
NaN out of 5
Radar ChartMicrosoft CorporationPower BI visualsMultiple measures plotted over a categorical axis. Useful to compare attributes
Applicable to:Power BI visuals
NaN out of 5
By getting this product, I give Microsoft permission to use or share my account information so that the provider can contact me regarding this product and related products. I agree to the provider's terms of use and privacy policy and understand that the rights to use this product do not come from Microsoft, unless Microsoft is the provider. Use of AppSource is governed by separate terms and privacy.