Pricing Additional purchase may be required
GCC Visualization Add-ins are a collection of visualization tools used in Excel for data analysis.
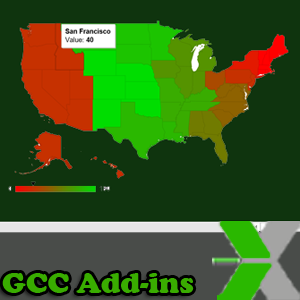
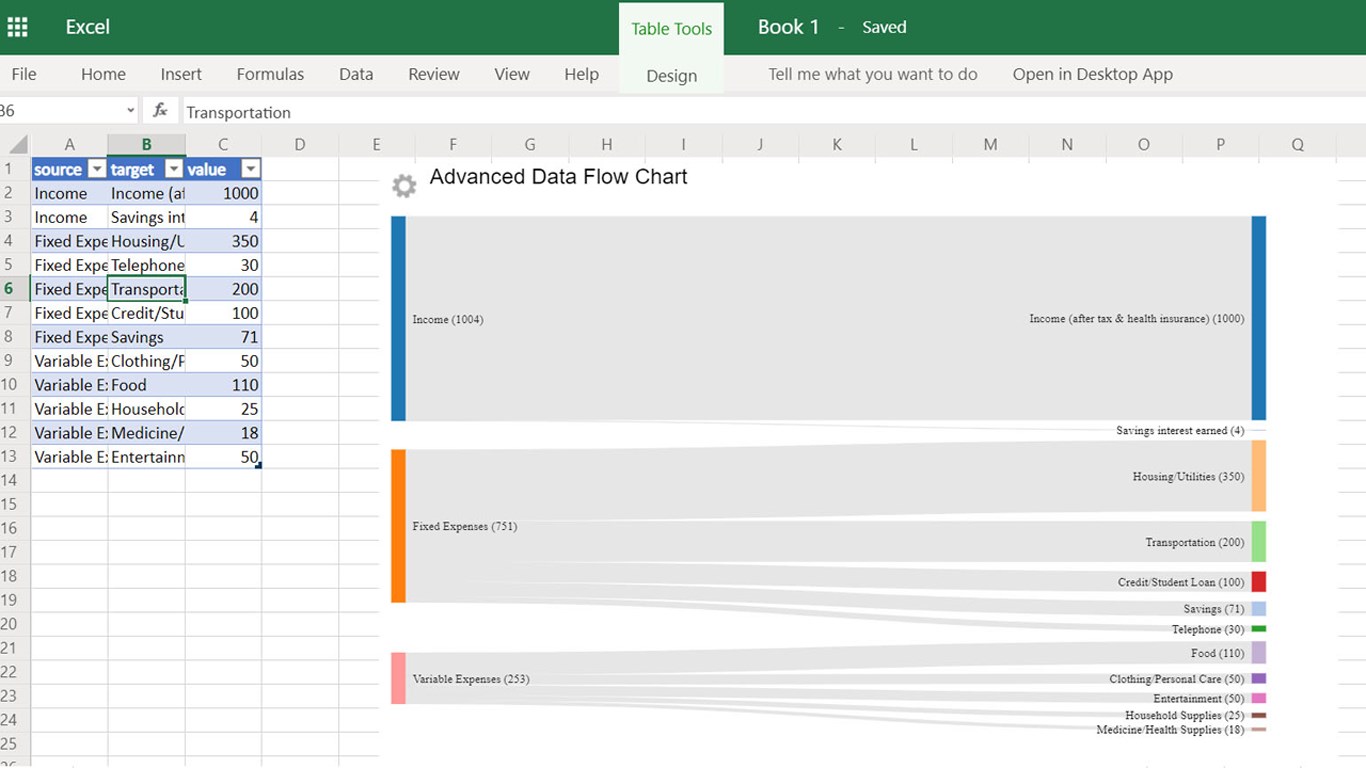
GCC Visualization add-ins provide over 30 graphic tools for the user to visualize the data in Excel content page for analytic and presentation purpose. GCC Excel Add-ins published in Microsoft Office store have been widely used by students, teachers, and data analysts in various industries. The most popular ones are the data maps, organization chart, data flow chart, decision tree diagram, histogram chart, waterfall chart, etc.
This version of GCC Add-ins centralize all the existing GCC Office Add-ins in one entry and uses Microsoft Saas model for the subscription and authentication. All the functionalities in the GCC Office Add-ins remain. Several UI enhancements are made to adapt the full screen adjustable content page in Excel online.
App capabilities
When this app is used, it
- Can read and make changes to your document
- Can send data over the Internet
At a glance
By getting this product, I give Microsoft permission to use or share my account information so that the provider can contact me regarding this product and related products. I agree to the provider's terms of use and privacy policy and understand that the rights to use this product do not come from Microsoft, unless Microsoft is the provider. Use of AppSource is governed by separate terms and privacy.