FiltersClear all
Apps results
Showing 751 results in apps.
Power BI visualsRemove Power BI visuals
Power PlatformRemove Power Platform

Astra - Large Scale Network GraphsSecureMetrics Power BI visualsVisualize relationships with Astra, a Power BI plugin for interactive network graph analysis.
Applicable to:Power BI visuals
1 out of 60

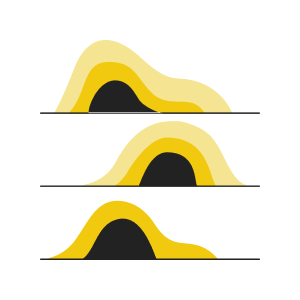
Horizon Chart by PowervizTRUVIZ INCPower BI visualsVisualize time series data with layered area chart stacked vertically to compare multiple categories
Applicable to:Power BI visuals
2 out of 60
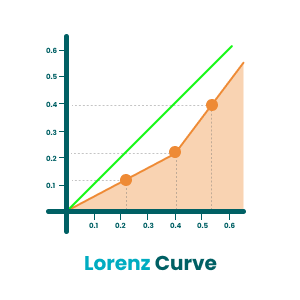
Lorenz Curve By Office SolutionOffice SolutionPower BI visualsLorenz Curve is a graphical representation of income inequality or wealth inequality.
Applicable to:Power BI visuals
3 out of 60
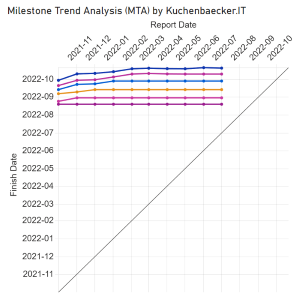
Milestone Trend Analysis (MTA)Kuchenbäcker ITPower BI visualsVisual progress of past and future project milestones or tasks
Applicable to:Power BI visuals
4 out of 60

Process FlowSCvation GmbHPower BI visualsVisualize your business processes, including automatic variant computation and key metrics
Applicable to:Power BI visuals
5 out of 60

Drill Down Network PRO (Filter) by ZoomChartsZoomChartsPower BI visualsCreate beautiful, easy to explore networks from category-based data.
Applicable to:Power BI visuals
6 out of 60

Funnel ChartsGovernment of Western Australia - Department of HealthPower BI visualsCreate a funnel plot to identify outliers in your cross-sectional data
Applicable to:Power BI visuals
7 out of 60
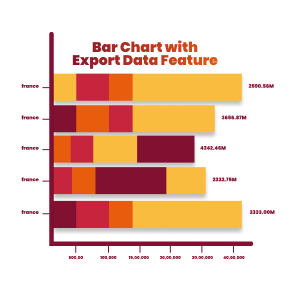
Bar Chart with Export Data FeatureOffice SolutionPower BI visualsBar Chart with Export Data Feature
Applicable to:Power BI visuals
8 out of 60

Smart Grid-MapThe Green Bridge GmbHPower BI visualsPrecise Geospatial Mapping and Data Visualization for Power BI
Applicable to:Power BI visuals
9 out of 60

Dot ChartMAREK PILCZUKPower BI visualsDot Chart - a sophisticated, yet straightforward tool to convey complex data narratives visually.
Applicable to:Power BI visuals
10 out of 60
Advanced Line Chart (Pro)PBIVizEdit.comPower BI visualsVisualize up to 8 measures with different styles of line on dual y axes
Applicable to:Power BI visuals
11 out of 60
Stacked Column with Percentage and Total in Label (Standard)PBIVizEdit.comPower BI visualsVisualize the growth or change in terms of percentage in data bars.
Applicable to:Power BI visuals
12 out of 60

Plotly Waterfall ChartCommunicatie in BedrijfPower BI visualsThis visual uses the Plotly JS Waterfall Chart.
Applicable to:Power BI visuals
13 out of 60
Dual Card ProInservit LLCPower BI visualsCompare KPIs with advanced formatting options.
Applicable to:Power BI visuals
14 out of 60

Supermetrics Charts – Tile grid mapSupermetricsPower BI visualsCreate (heat)maps with tiles of the same shape and size
Applicable to:Power BI visuals
15 out of 60

HTML/SVG/Handlebars VisualIlfat GalievPower BI visualsThe visual uses Handlebars.js to render template and bind data from Power BI
Applicable to:Power BI visuals
16 out of 60

swTable上北智信Power BI visuals表格是一种可视化交流模式,又是一种组织整理数据的手段。人们在通讯交流、科学研究以及数据分析活动当中广泛采用着形形色色的表格。
Applicable to:Power BI visuals
Significant VarianceDataMaPower BI visualsSignificant Variant analyzes KPI differences with statistical significance
Applicable to:Power BI visuals
18 out of 60

Horizontal Bullet Chart (Pro)PBIVizEdit.comPower BI visualsShow progress of measure towards a goal and/or its performance against a reference
Applicable to:Power BI visuals
19 out of 60

Cohort Analysis By Office SolutionOffice SolutionPower BI visualsCohort Analysis in Power BI is a visual tool to analyze the behavior of groups (cohorts) over time.
Applicable to:Power BI visuals
20 out of 60

Enlighten Outer SpaceENLIGHTEN DESIGNSPower BI visualsCreate a report that is out of this world with this space-themed visualization!
Applicable to:Power BI visuals
21 out of 60

Innofalls ChartsInnofalls GmbHPower BI visualsWaterfall and bar charts with new comparison features. Stacked, deviations, grouping and more!
Applicable to:Power BI visuals
22 out of 60
Apex Milestone TrendAPEX Project Management Inc.Power BI visualsA professional chart for monitoring and tracking milestone dates
Applicable to:Power BI visuals
23 out of 60

Comment - Dynamics 365 Finance business performance planningMicrosoft Dynamics 365Power BI visualsCapture commentary during planning process from within Power BI reports.
Applicable to:Power BI visuals
24 out of 60

Side By Side Bar Chart (Standard)PBIVizEdit.comPower BI visualsVisualize up to 6 measures adjacent to each other with different X axes
Applicable to:Power BI visuals
25 out of 60
Vertical Bullet Chart (Pro)PBIVizEdit.comPower BI visualsShow progress of measure towards a goal and/or its performance against a reference
Applicable to:Power BI visuals
26 out of 60

Dual X-axis Bar Chart (Standard)PBIVizEdit.comPower BI visualsEasily illustrate the relationships between two variables with different magnitudes.
Applicable to:Power BI visuals
27 out of 60
DoubleYaxis上北智信Power BI visuals双Y轴的折线柱状图
Applicable to:Power BI visuals

100% Clustered Stacked Column Chart (Pro)PBIVizEdit.comPower BI visualsTo compare two numerical variables by category with each column further segmented by sub-categories
Applicable to:Power BI visuals
29 out of 60

Power BI User Activity TrackerALTORO CONSULTING GROUP SLPower BI visualsAnalyze how users interact with reports published in Power BI Online
Applicable to:Power BI visuals
30 out of 60

Process Flow DiagramViz Data LtdPower BI visualsProcess Flow Diagram is a stylish Power BI custom visual that makes your reports stand out
Applicable to:Power BI visuals
31 out of 60

Ultimate Waterfall (API)dataviz.boutique GmbHPower BI visualsStart Value, Chart Orientation, Small Multiples, Sub Totals, Deviation, IBCS (R) Table
Applicable to:Power BI visuals
32 out of 60
Change ChartMAREK PILCZUKPower BI visualsChange Chart - capturing data transitions with clarity through intuitive arrow-based visuals.
Applicable to:Power BI visuals
33 out of 60

Candlestick Chart (Standard)PBIVizEdit.comPower BI visualsUse this chart to compare the price movements in financial markets along with multiple indicators
Applicable to:Power BI visuals
34 out of 60

Ahp Decision MakerWead TechnologyPower BI visualsA multi-criteria decision support tool, calculate which are the best choices.
Applicable to:Power BI visuals
35 out of 60

ExcaliburIQZ Systems, LLCPower BI visualsTrack patterns, classify data, work on clusters and perform many other types of analysis.
Applicable to:Power BI visuals
36 out of 60

Drill Down Pie PRO (Pin) by ZoomChartsZoomChartsPower BI visualsEnjoy interactive drilldowns, user friendly navigation and beautiful design.
Applicable to:Power BI visuals
37 out of 60

Matrix PlannerIlustratownPower BI visualsFacilitates planning and forecasting through writeback functionality within Power BI
Applicable to:Power BI visuals
38 out of 60

From Visuals Process ChartFrom VisualsPower BI visualsVisualize any process data with an intuitive and interactive process visual for Power BI
Applicable to:Power BI visuals
39 out of 60

JVIZ Product RoadmapJINETT Inc.Power BI visualsVisualize rolling project data and perform year-over-year (YoY) portfolio management.
Applicable to:Power BI visuals
40 out of 60

Voronoi Diagram By Office SolutionOffice SolutionPower BI visualsA Voronoi diagram divides a plane into regions based on the distance to a specific set of points.
Applicable to:Power BI visuals
41 out of 60

时勤Echart-Customized_Funne上海时勤信息科技有限公司Power BI visualsThis product is an advanced visualization object designed specifically for Power BI users. It utiliz
Applicable to:Power BI visuals
42 out of 60

Drill Down Waterfall PRO (Pin) by ZoomChartsZoomChartsPower BI visualsControl column sequence, add subtotals and drill down into each category.
Applicable to:Power BI visuals
43 out of 60
swColorMap_twoLevels上北智信Power BI visuals中国色块地图下钻,可支持下钻地级,根据数据以色块层级展示在地图块上。
Applicable to:Power BI visuals

时勤Echart-Basic_Sankey上海时勤信息科技有限公司Power BI visualsSankey chart is a special type of chart used to display the distribution of data, particularly suita
Applicable to:Power BI visuals
45 out of 60

Likert Scale (Standard)PBIVizEdit.comPower BI visualsRepresent people's attitudes and opinions to a topic
Applicable to:Power BI visuals
46 out of 60

Writeback Comments by ProfitbaseProfitbase ASPower BI visualsComment on any data in Power BI and save changes to any destination
Applicable to:Power BI visuals
47 out of 60
Bubble Chart with Categorical Data (Pro)PBIVizEdit.comPower BI visualsVisualize categorical data on both axes in bubble chart
Applicable to:Power BI visuals
48 out of 60

Cumulative by sio2Graphssio2GraphsPower BI visualsPlot frequency against categorical or grouped data, creating a cumulative frequency distribution.
Applicable to:Power BI visuals
49 out of 60

BENE.BIZ Date Range SlicerAlexander RezunPower BI visualsDynamic relative date/time filtering (e.g., “last X days”) that respects each user’s local time zone
Applicable to:Power BI visuals
50 out of 60
Acterys Reporting for FP&AManagilityPower BI visualsProfessional financial reports with custom calculations, comments & visualizations according to IBCS
Applicable to:Power BI visuals
51 out of 60

Lollipop Column Chart (Standard)PBIVizEdit.comPower BI visualsA clearer visualization than column charts for large number of categories
Applicable to:Power BI visuals
52 out of 60

TabulatorTekvo.ioPower BI visualsThe Tabulator Custom Visual is a powerful tool to enhance your reports
Applicable to:Power BI visuals
53 out of 60

Circle Packing with Clusters (BI-Champ Suite)CodeX Enterprises LLCPower BI visualsGroup data in nested circles, optionally cluster related data using machine learning
Applicable to:Power BI visuals
54 out of 60

Stacked Vertical Funnel Chart (Pro)PBIVizEdit.comPower BI visualsVisualize flow of data across different stages with stacking based on sub-category in each stage.
Applicable to:Power BI visuals
55 out of 60

Graphical planning - Dynamics 365 Finance business performance planningMicrosoft Dynamics 365Power BI visualsPlan visually by dragging various bar or line charts.
Applicable to:Power BI visuals
56 out of 60

Acterys Matrix Planning For Power BI Gen2ManagilityPower BI visualsAdvanced writeback, planning, and forecasting with Acterys Matrix Gen 2 for Power BI.
Applicable to:Power BI visuals
57 out of 60

100% Clustered Stacked Column Chart (Standard)PBIVizEdit.comPower BI visualsTo compare two numerical variables by category with each column further segmented by sub-categories
Applicable to:Power BI visuals
58 out of 60

Archilogic Floor Plan VisualizationArchilogic AGPower BI visualsThe 3D Archilogic Floor Plan Power BI plugin
Applicable to:Power BI visuals
59 out of 60

JVIZ Strategic RoadmapJINETT Inc.Power BI visualsTrack work-in-progress (WIP), strategic goals and initiatives across various categories.
Applicable to:Power BI visuals
60 out of 60