FiltersClear all
Apps results
Showing 749 results in apps.
Power BI visualsRemove Power BI visuals
Power PlatformRemove Power Platform


Visio VisualMicrosoft Corporation Power BI visualsBring your business activities to life in ways that only Microsoft Visio diagrams can visualize
Applicable to:Power BI visuals
1 out of 60

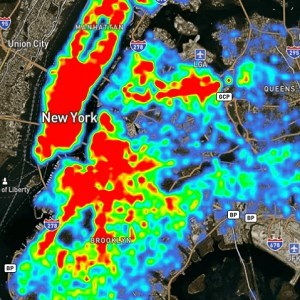
Heatmap VisualDEFTEAM SOLUTIONS PRIVATE LIMITEDPower BI visualsVisualizing multidimensional data using Heatmap Visual
Applicable to:Power BI visuals
2 out of 60
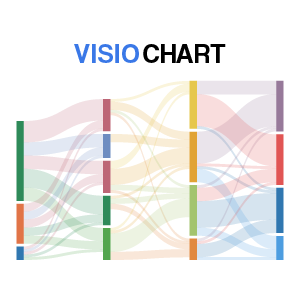
Sankey DiagramVisioChartPower BI visualsVisualize your complex data flow patterns with Power BI's Sankey Diagram by VisioChart
Applicable to:Power BI visuals
3 out of 60

Violin PlotDaniel Marsh-PatrickPower BI visualsUse to visualise the distribution of your data.
Applicable to:Power BI visuals
4 out of 60
Mapbox Custom VisualStarschema Kereskedelmi es Szolgaltato Korlatolt Felelossegu TarsasagPower BI visualsNext gen maps. Create heatmaps, shape maps, circles, and clusters using big location data.
Applicable to:Power BI visuals
5 out of 60
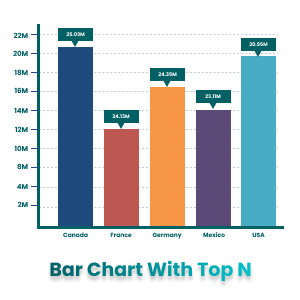
Bar Chart With Top N SelectionOffice SolutionPower BI visualsSelect Top N number of items to be displayed in chart and rest items will be clubbed as others
Applicable to:Power BI visuals
6 out of 60

Drill Down Pie PRO (Filter) by ZoomChartsZoomChartsPower BI visualsEnjoy interactive drilldowns, user friendly navigation and beautiful design.
Applicable to:Power BI visuals
7 out of 60

HierarchySlicerDataScenariosPower BI visualsCreate a hierarchy of different fields and use it as a slicer with Power BI.
Applicable to:Power BI visuals
8 out of 60

Mapspbi-consultantsPower BI visualsDiscover the ultimate interactive map visual that combines point, shape, and flow mapping.
Applicable to:Power BI visuals
9 out of 60

Financial Reporting Matrix by ProfitbaseProfitbase ASPower BI visualsEasily build financial reports with line formatting, conditional formatting, subtotals and more.
Applicable to:Power BI visuals
10 out of 60

Your Timeline SlicerBased OnPower BI visualsAn optimized powerful date slicer with a compact mode support to save space.
Applicable to:Power BI visuals
11 out of 60
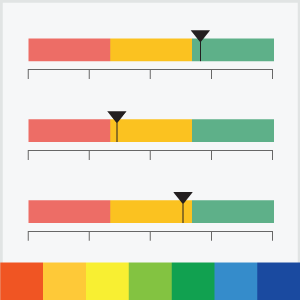
Linear Gauge - xVizxViz LLCPower BI visualsVisualize your KPIs to track its progress against key metrics with Custom labels, ranges and limits!
Applicable to:Power BI visuals
12 out of 60

Image GridFredrik HedenströmPower BI visualsVisualize images in Power BI.
Applicable to:Power BI visuals
13 out of 60

Filter by ListDEVSCOPEPower BI visualsApply filter values to a report in bulk instead of individually checking each box in the filter pane
Applicable to:Power BI visuals
14 out of 60

Advanced Toggle Switch by TME AGTME AGPower BI visualsShow and hide multiple data fields with switch on/off
Applicable to:Power BI visuals
15 out of 60
Multi Line Chart with TooltipsDatanautsPower BI visualsThe Multi Line Chart packed with features that puts the joy in time series analysis
Applicable to:Power BI visuals
16 out of 60
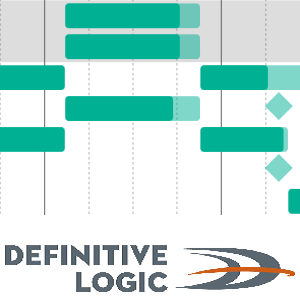
Definitive Logic Advanced Gantt ChartDefinitive LogicPower BI visualsA Gantt Chart with task swim lanes and advanced customization
Applicable to:Power BI visuals
17 out of 60

Inforiver Reporting MatrixxViz LLC dba LumelPower BI visualsThe most comprehensive matrix for Financial, Management, Variance, Paginated & IBCS reporting
Applicable to:Power BI visuals
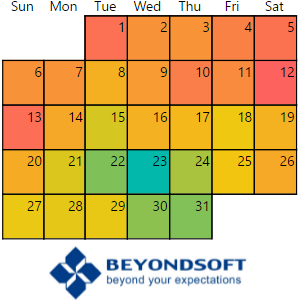
Beyondsoft CalendarManny MerinoPower BI visualsVisualize your monthly data and assign custom colors with this dynamic, data-driven calendar visual.
Applicable to:Power BI visuals
19 out of 60
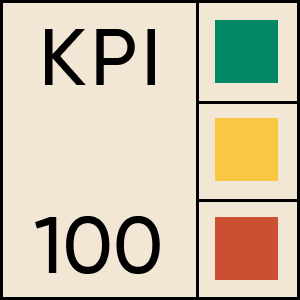
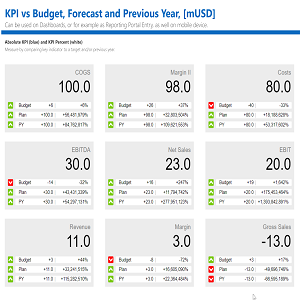
Multi target KPIAlex KolokolovPower BI visualsCrisp-n-clear visualization for your KPIs!
Applicable to:Power BI visuals
20 out of 60

GANTT by LingaroLingaroPower BI visualsTrack all your projects with full visibility of every phase and milestone!
Applicable to:Power BI visuals
21 out of 60
Ultimate KPI Carddataviz.boutique GmbHPower BI visualsShows a value, its variance to a reference value and its variance to 2nd or 3rd refetence value.
Applicable to:Power BI visuals
22 out of 60

Box and Whisker chartDataScenariosPower BI visualsVisualize a dataset in an effective way as a five-number summary (mean, median, quartiles, min/max)
Applicable to:Power BI visuals
23 out of 60

3D PieChart and Donut Chart by iFouriFour Technolab Pvt. Ltd.Power BI visualsThis custom 3D pie chart shows proportions with labeled slices and a 3D effect.
Applicable to:Power BI visuals
24 out of 60

Zebra BI CardsZebra BIPower BI visualsInsanely flexible KPI scorecards. Multi-cards with variances, sparklines, comments, drill-through.
Applicable to:Power BI visuals
25 out of 60
Tachometer by E&AEarnest and AssociatesPower BI visualsTachometer which allows for 7 ranges.
Applicable to:Power BI visuals
26 out of 60
Google Maps for Power BIDynamica Labs LTDPower BI visualsGoogle Maps for Power BI is a visual that helps display and analyze data on Google Maps.
Applicable to:Power BI visuals
27 out of 60

Force-Directed GraphMicrosoft CorporationPower BI visualsForce layout diagram with curved path. Useful to show connections between entities
Applicable to:Power BI visuals
28 out of 60

Timeline by QueryonQueryonPower BI visualsA single-axis timeline packed with features.
Applicable to:Power BI visuals
29 out of 60
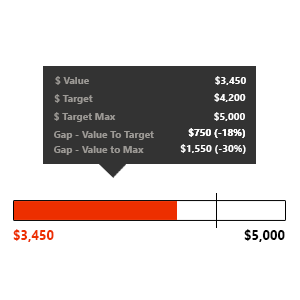
Slim data bar KPI VisualDellCablePower BI visualsA power bi custom visual providing a slim data bar visual for KPI based analysis.
Applicable to:Power BI visuals
30 out of 60

Hierarchy Chart by MAQ SoftwareMAQ LLCPower BI visualsStreamline your organizational insights | Power BI Certified
Applicable to:Power BI visuals
31 out of 60

Selection Slicer by Walnut InnovationWalnut Innovation LimitedPower BI visualsMulti-category slicer/filter showing selected and unavailable choices
Applicable to:Power BI visuals
32 out of 60

Multiple Axes Chart - XVizxViz LLC dba LumelPower BI visualsVisualize data with multiple Y-axes, 10+ series types, 20+ chart configurations, annotations & more!
Applicable to:Power BI visuals
33 out of 60

Org Chart Drag and DropWorkforceVision LTDPower BI visualsVisualise your organization structure through a customisable drag and drop Organization Chart
Applicable to:Power BI visuals
34 out of 60
Google TrendspbiCraftPower BI visualsUse Google Trends as your dataset
Applicable to:Power BI visuals
35 out of 60

hi-chart Reporting StudioCP Corporate Planning GmbHPower BI visualsPerfect business graphics are automatically prepared for your data. There is no easier way.
Applicable to:Power BI visuals
36 out of 60
graphomate matrixgraphomatePower BI visualsMeaningful Tabular Visualization: Data-Driven, Fully IBCS-Compliant, In-Cell Charts and Calculations
Applicable to:Power BI visuals
37 out of 60

Sparkline by OKVIZOKVIZ Corp.Power BI visualsDisplays the trend of multiple measures or category items on a single line, minimizing the footprint
Applicable to:Power BI visuals
38 out of 60

Preselected SlicerInsiders.coopPower BI visualsThe Preselected Slicer is a slicer for Power BI where values can be pre-selected by your data.
Applicable to:Power BI visuals
39 out of 60
Cylindrical Gauge by MAQ SoftwareMAQ LLCPower BI visualsVisualize targets with precision | Power BI Certified
Applicable to:Power BI visuals
40 out of 60

Histogram by PQ SystemsPQ SystemsPower BI visualsThe histogram is a bar chart to visualize the distribution of data and a collection of statistics.
Applicable to:Power BI visuals
41 out of 60

Image by CloudScopeCloudScope, LLCPower BI visualsDisplay beautiful data-bound images with tooltips and links using urls from your Power BI reports.
Applicable to:Power BI visuals
42 out of 60

Funnel Chart by PowervizTRUVIZ INCPower BI visualsAn Advanced Funnel Chart to visualize and track the data movement across different stages
Applicable to:Power BI visuals
43 out of 60

Acterys Gantt for Project ManagementManagilityPower BI visualsPlan, update, and manage projects effortlessly within Power BI using Acterys Gantt.
Applicable to:Power BI visuals
44 out of 60

Radar Chart by MAQ SoftwareMAQ LLCPower BI visualsUnlock multi-variable insights with a single chart | Power BI Certified
Applicable to:Power BI visuals
45 out of 60

SuperTablesApps for Power BI Power BI visualsOffer viewers the power of interactive and dynamic Excel-like tables
Applicable to:Power BI visuals
46 out of 60

Calendar by TallanTallan, IncPower BI visualsA standard calendar layout that filters and aggregates data across a range of dates.
Applicable to:Power BI visuals
47 out of 60

Hierarchy Chart by AkvelonAkvelonPower BI visualsShow any type of hierarchical data in a tree format such as organization and family trees
Applicable to:Power BI visuals
48 out of 60

Activity Gauge by PowervizTRUVIZ INCPower BI visualsAn Advanced Visual to measure the progress against a set target or Goal for multiple categories
Applicable to:Power BI visuals
49 out of 60

Data SlicerSCvation GmbHPower BI visualsFilter large datasets with ease using bulk insert or interval conditions, including text/number/date
Applicable to:Power BI visuals
50 out of 60
decomposition_treeExcelnaccess.comPower BI visualsDecomposition tree visual lets you visualize data across multiple dimensions
Applicable to:Power BI visuals
51 out of 60

Advanced Pie and Donut - xVizxViz LLC dba LumelPower BI visualsVisualize categories as individual slices with multiple pie/donut chart types and functionalities
Applicable to:Power BI visuals
52 out of 60

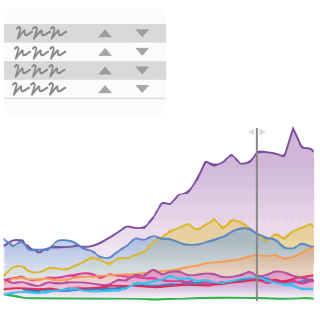
Line and Stacked Column Chart with TableDefinitive LogicPower BI visualsA line and stacked column chart with a data table of values displayed below.
Applicable to:Power BI visuals
53 out of 60

Inforiver Writeback Matrix for Planning, Budgeting & ForecastingxViz LLC dba LumelPower BI visualsEnterprise-grade writeback matrix for building connected & secure planning (xP&A / FP&A / EPM) apps
Applicable to:Power BI visuals
54 out of 60

KPI by PowervizTRUVIZ INCPower BI visualsBuild KPI cards beyond imagination with 16 chart layers, small multiples, and on-object interaction
Applicable to:Power BI visuals
55 out of 60

Route mapWeiwei CuiPower BI visualsVisualize trajectories on a map
Applicable to:Power BI visuals
56 out of 60

PowerGantt ChartNova SilvaPower BI visualsPowerful insight into your planning and milestone performance
Applicable to:Power BI visuals
57 out of 60

Charticulator Visual Community (Editor)Ilfat GalievPower BI visualsCreate custom and reusable charts right within Power BI in the new visual
Applicable to:Power BI visuals
58 out of 60

Heatmap by PowervizTRUVIZ INCPower BI visualsAn Advanced customizable Heatmap with Colors, Shapes, and Small Multiples for detailed analysis
Applicable to:Power BI visuals
59 out of 60
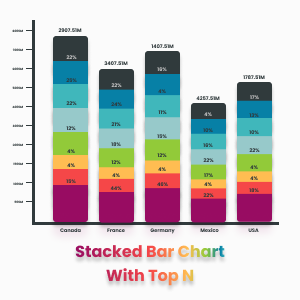
Stacked Bar Chart With Top NOffice SolutionPower BI visualsStacked bar chart with feature of selected top n number of values to filter out others
Applicable to:Power BI visuals
60 out of 60