FiltersClear all
Apps results
Showing 763 results in apps.
Power BI visualsRemove Power BI visuals
Power PlatformRemove Power Platform

Rotating Chart by MAQ SoftwareMAQ LLC Power BI visualsShowcase multiple key performance indicators with a rotating bar chart | PBI certified
Applicable to:Power BI visuals
1 out of 60

Laconic Card - FreeDotelus ABPower BI visualsA clutter-free card visual for displaying your KPIs.
Applicable to:Power BI visuals
2 out of 60

Floor Plan Visual by Simpson AssociatesSIMPSON ASSOCIATES INFORMATION SERVICES LIMITEDPower BI visualsVisualise your data against your real-world floor plans
Applicable to:Power BI visuals
3 out of 60

KPI Column by MAQ SoftwareMAQ LLCPower BI visualsMeasure your progress toward key performance indicators (KPIs) with integrated line and column chart
Applicable to:Power BI visuals
4 out of 60

Drill Down Waterfall PRO (Filter) by ZoomChartsZoomChartsPower BI visualsControl column sequence, add subtotals and drill down into each category.
Applicable to:Power BI visuals
5 out of 60

Dot PlotMicrosoft CorporationPower BI visualsShow the distribution of frequencies in a great looking way
Applicable to:Power BI visuals
6 out of 60

Drill Down Combo PRO (Filter) by ZoomChartsZoomChartsPower BI visualsCombine columns, lines and areas in one chart. Enjoy interactive drilldowns and beautiful design.
Applicable to:Power BI visuals
7 out of 60

Horizontal Bullet Chart (Standard)PBIVizEdit.comPower BI visualsShow progress of measure towards a goal and/or its performance against a reference
Applicable to:Power BI visuals
8 out of 60

Text Enhancer by MAQ SoftwareMAQ LLCPower BI visualsCustomize the text in your Power BI reports | PBI certified
Applicable to:Power BI visuals
9 out of 60
egHeatmapegnite, Inc.Power BI visualsA heatmap table to see different values per row by color.
Applicable to:Power BI visuals
10 out of 60

Aimplan Planning and Reporting VisualAimplan ABPower BI visualsExtend Power BI with Planning, Forecasting, Budgeting, and Financial Reporting
Applicable to:Power BI visuals
11 out of 60

Multiple Axes Chart (Standard)PBIVizEdit.comPower BI visualsShow relationship between data sets by combining columns, lines, scatter, area on dual Y-axes
Applicable to:Power BI visuals
12 out of 60

Dumbbell Bar ChartNova SilvaPower BI visualsUnleash the power of comparison with the Dumbbell Bar Chart
Applicable to:Power BI visuals
13 out of 60

Acterys Matrix LightManagilityPower BI visualsFlexible matrix reporting with selective drill down and filtering.
Applicable to:Power BI visuals
14 out of 60

Pie Charts TreeAritz FrancoyPower BI visualsDisplay in tree mode with values represented in a pie chart in each node.
Applicable to:Power BI visuals
15 out of 60

DROPDOWNCuong MaiPower BI visualsTable with Dropdown by Cells which operates independently, allowing users to select different option
Applicable to:Power BI visuals
16 out of 60

Easy SPCBCN Group Ltd.Power BI visualsRevolutionise your decision making with EasySPC.
Applicable to:Power BI visuals
17 out of 60

Power Slicer北京上北智信科技有限公司Power BI visualsMulti-dimensional slices have been added and support for default dynamics
Applicable to:Power BI visuals
18 out of 60
Advanced Trellis / Small Multiples - xVizxViz LLCPower BI visuals
xViz Advanced Trellis visual is a group of similar charts having a common axis and value fields
Applicable to:Power BI visuals
19 out of 60

Ratings by MAQ SoftwareMAQ LLCPower BI visualsIndicate performance or approval scores within you Power BI reports.
Applicable to:Power BI visuals
20 out of 60

Funnel with Source by MAQ SoftwareMAQ LLCPower BI visualsTrack data pipeline from end to end by grouping data into stages and sources | PBI certified
Applicable to:Power BI visuals
21 out of 60

swSankeyDiagram上北智信Power BI visuals桑基图即桑基能量分流图,也叫桑基能量平衡图。它是一种特定类型的流程图,图中延伸的分支的宽度对应数据流量的大小。
Applicable to:Power BI visuals

Annotated Bar by QueryonQueryonPower BI visualsAdd callouts to important bars, or just read stacked, clustered, or overlapping bar data clearly.
Applicable to:Power BI visuals
23 out of 60
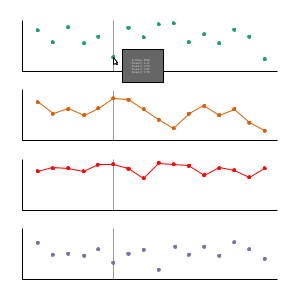
Time-lines (BI-Champ Suite)CodeX Enterprises LLCPower BI visualsCreate a time-line with dots representing events, keyed by dates.
Applicable to:Power BI visuals
24 out of 60

Dual Y-Axis Column Chart (Standard)PBIVizEdit.comPower BI visualsEasily illustrate the relationships between two variables with different magnitudes
Applicable to:Power BI visuals
25 out of 60

Composed Line Area Bar Chart by Devlup FunnelsDevlup FunnelsPower BI visualsThe Composed Line Area Bar Chart is a visually engaging data visualization that combines the feature
Applicable to:Power BI visuals
26 out of 60
Dual Y-Axis Combo Chart (Pro)PBIVizEdit.comPower BI visualsShow relationship between data sets by combining columns, lines, scatter, area on dual Y-axes
Applicable to:Power BI visuals
27 out of 60

Organization Chart北京上北智信科技有限公司Power BI visualsA standardized structure diagram generation control.
Applicable to:Power BI visuals
28 out of 60

Lollipop Bar Chart (Standard)PBIVizEdit.comPower BI visualsA clearer visualization than bar charts for large number of categories
Applicable to:Power BI visuals
29 out of 60
Multiple Stacked ChartsPro2Future GmbHPower BI visualsVisual for comparing multiple data columns that share one X-axis.
Applicable to:Power BI visuals
30 out of 60
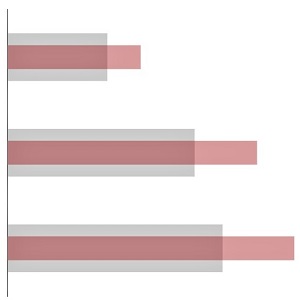
Overlapping Bar ChartAcorn HillPower BI visualsHorizontal bar chart allowing overlapping of bars and extensive customization.
Applicable to:Power BI visuals
31 out of 60

process.science Process Miningprocess.science GmbH & Co. KGPower BI visualsExperience Process Mining in Power BI with process.science. Visualize, understand, optimize.
Applicable to:Power BI visuals
32 out of 60

Forecast using Neural Network by MAQ SoftwareMAQ LLCPower BI visualsUse the Neural Network algorithm to forecast future values based on historical data.
Applicable to:Power BI visuals
33 out of 60
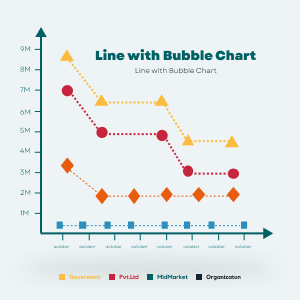
Line with Bubble ChartOffice SolutionPower BI visualsChart with combination of Line & bubble in which both objects can be derive with a numerical measure
Applicable to:Power BI visuals
34 out of 60
swOrgChart_2.1sharewinfohkPower BI visualscan be applied to business scenarios such as company organizational structure and family genealogy
Applicable to:Power BI visuals
Traqplan Timeline ProTraqplanPower BI visualsCreates a plan on a page or gantt timeline for multiple projects with edge-wrap and change tracking.
Applicable to:Power BI visuals
36 out of 60

KPI Treepbi-consultantsPower BI visualsVisualize and Explore Key Metrics Hierarchically with KPI Tree.
Applicable to:Power BI visuals
37 out of 60

Animator for Power BIINOVISTA LIMITEDPower BI visualsCreate custom, data-driven chart and infographic animations based on any SVG image.
Applicable to:Power BI visuals
38 out of 60

Bubble Chart with Categorical Data (Standard)PBIVizEdit.comPower BI visualsVisualize categorical data on both axes in bubble chart
Applicable to:Power BI visuals
39 out of 60

Drill Down Network PRO (Pin) by ZoomChartsZoomChartsPower BI visualsCreate beautiful, easy to explore networks from category-based data.
Applicable to:Power BI visuals
40 out of 60
swColorMap上北智信Power BI visuals中国色块地图下钻,可支持下钻到省县级,可根据数据展示色块分布。
Applicable to:Power BI visuals

Global Launch EstimatesTheraTraqPower BI visualsVisualize your locations in the Map view highlighted based on the associated year.
Applicable to:Power BI visuals
42 out of 60

TheraTraq Timeline CircleTheraTraqPower BI visuals Visualize your events in a timeline view.
Applicable to:Power BI visuals
43 out of 60

ArcGIS for Power BIEsri, Inc.Power BI visualsCustom data visualization to bring mapping capabilities to your reports and dashboards.
Applicable to:Power BI visuals
44 out of 60

Writeback GridCreative DataPower BI visualsUnlocks advanced data editing and seamless writeback using an intuitive grid visual
Applicable to:Power BI visuals
45 out of 60
Category Comparison Bar ChartDatanautsPower BI visualsThe Bar Chart you've probably never seen before
Applicable to:Power BI visuals
46 out of 60

PackedBubbleChartQatar Financial Centre Regulatory AuthorityPower BI visualsPacked Bubble Chart
Applicable to:Power BI visuals

Scatter Chart by AkvelonAkvelonPower BI visualsVisualize your data with Scatter Chart with rectangle selection support
Applicable to:Power BI visuals
48 out of 60

Enlighten SlicerENLIGHTEN DESIGNSPower BI visualsProvides a simple way to interact with your data.
Applicable to:Power BI visuals
49 out of 60

ComicgenGramenerPower BI visualsComicgen adds comic characters whose emotion, pose, angle, etc can be controlled by data.
Applicable to:Power BI visuals
50 out of 60

accoPLANNING - Writeback, Planning, MatrixAccobat ASPower BI visualsVisual with writeback directly in Power BI for planning, master data (MDM), budgeting, forecasting
Applicable to:Power BI visuals
51 out of 60

graphomate chartsgraphomatePower BI visualsgraphomate charts is a highly customizable visualization component
Applicable to:Power BI visuals
52 out of 60

AI Buddy by iFouriFour Technolab Pvt. Ltd.Power BI visualsAI Buddy lets users chat with Power BI data, gaining instant insights, summaries, and explanations
Applicable to:Power BI visuals
53 out of 60

Enlighten Waffle ChartENLIGHTEN DESIGNSPower BI visualsShow your data effectively with a waffle pop-out number and quote.
Applicable to:Power BI visuals
54 out of 60

Drill Down Combo Bar PRO (Filter) by ZoomChartsZoomChartsPower BI visualsCombine columns, lines, areas. Have multiple stacking options. Enjoy interactive drilldowns.
Applicable to:Power BI visuals
55 out of 60
Control ChartNova SilvaPower BI visualsThe most useful way to see true signals of change in your KPI is to use a ControlChart (XmR chart)
Applicable to:Power BI visuals
56 out of 60

Triangle Bar chart by Devlup FunnelsDevlup FunnelsPower BI visualsThis visual representation of data that uses triangular bars to display information
Applicable to:Power BI visuals
57 out of 60

Population Pyramid (Pro)PBIVizEdit.comPower BI visualsGraphically illustrate age and gender distribution of a given population
Applicable to:Power BI visuals
58 out of 60

E-Project Smart SlicerE-Project SrlPower BI visualsCustom slicer with additional performance and customization features
Applicable to:Power BI visuals
59 out of 60

Innofalls ChartsInnofalls GmbHPower BI visualsWaterfall and bar charts with new comparison features. Stacked, deviations, grouping and more!
Applicable to:Power BI visuals
60 out of 60