
Precios Gratis

Chord
por Microsoft Corporation
A graphical method of displaying the inter-relationships between data in a matrix
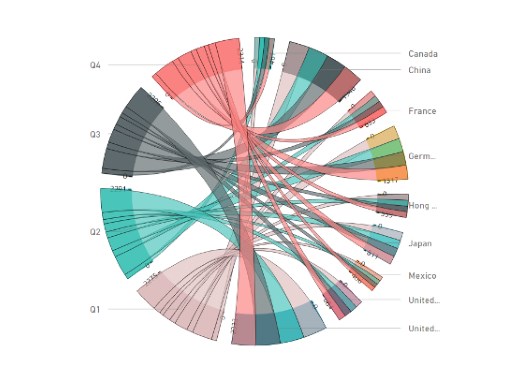
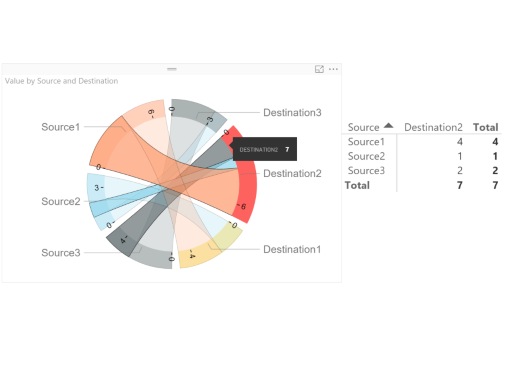
This type of diagram visualises the inter-relationships between entities. The connections between entities is used to display that they share something in common. This makes Chord Diagrams ideal for comparing the similarities within a dataset or between different groups of data.
Nodes are arranged around a circle, with the relationships between points connected to each other either through the use of arcs or Bézier curves. Values are assigned to each connection, which is represented proportionally by the size of each arc.
Customize data colors, axis, labels and more.
This is an open source visual. Get the code from GitHub: https://github.com/Microsoft/PowerBI-visuals-chord
Capacidades visuales
Este objeto visual está certificado por Power BI.
De un vistazo

Other aplicaciones de Microsoft Corporation


Text FilterMicrosoft Corporation Power BI visualsSearch across your dataset right from the dashboard
Applicable to:Power BI visuals
NaN out of 5

Word CloudMicrosoft CorporationPower BI visualsCreate a fun visual from frequent text in your data
Applicable to:Power BI visuals
NaN out of 5

GanttMicrosoft CorporationPower BI visualsA type of bar chart which illustrates a project timeline or schedule with resources
Applicable to:Power BI visuals
NaN out of 5

Chiclet SlicerMicrosoft CorporationPower BI visualsDisplay image and/or text buttons that act as an in-canvas filter on other visuals
Applicable to:Power BI visuals
NaN out of 5

Sankey ChartMicrosoft CorporationPower BI visualsFlow diagram where the width of the series is proportional to the quantity of the flow
Applicable to:Power BI visuals
NaN out of 5
Al obtener este producto, concede permiso a Microsoft para usar o compartir la información de mi cuenta para que el proveedor pueda ponerse en contacto conmigo con respecto a este producto y productos relacionados. Acepto los términos de uso y la directiva de privacidad del proveedor y entiendo que los derechos para usar este producto no proceden de Microsoft, a menos que Microsoft sea el proveedor. El uso de AppSource se rige por términos y privacidad independientes.