Precios Es posible que se requiera una compra adicional

Craydec Regression Chart
por Craydec Oy
Scatter chart with linear regression for large datasets. Easy to use and fast. With small multiples.
- Do you have a large dataset?
- You want to explore or report it from multiple angles?
- Do you want to use all of datapoints without aggregation?
- Need a linear regression with all of your datapoints?
If any of these sound familiar, you have found your visual.
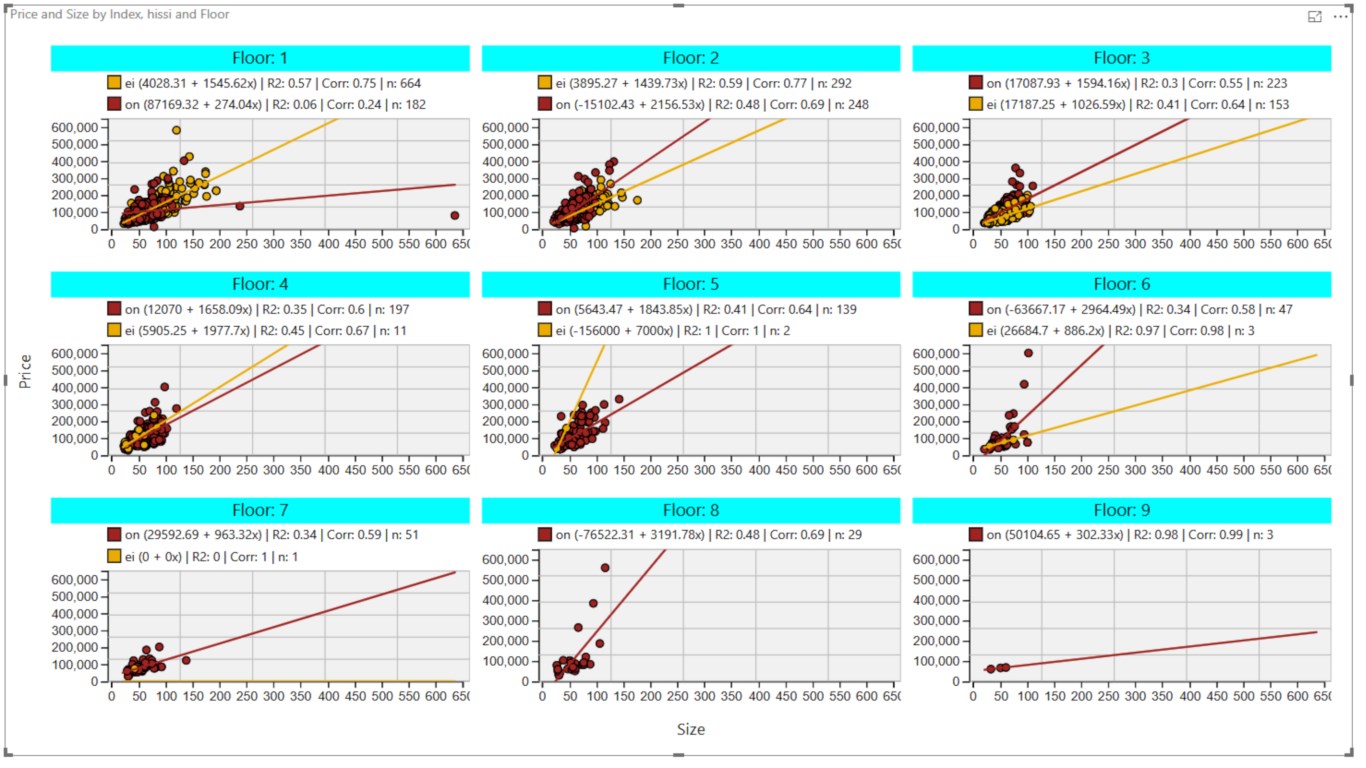
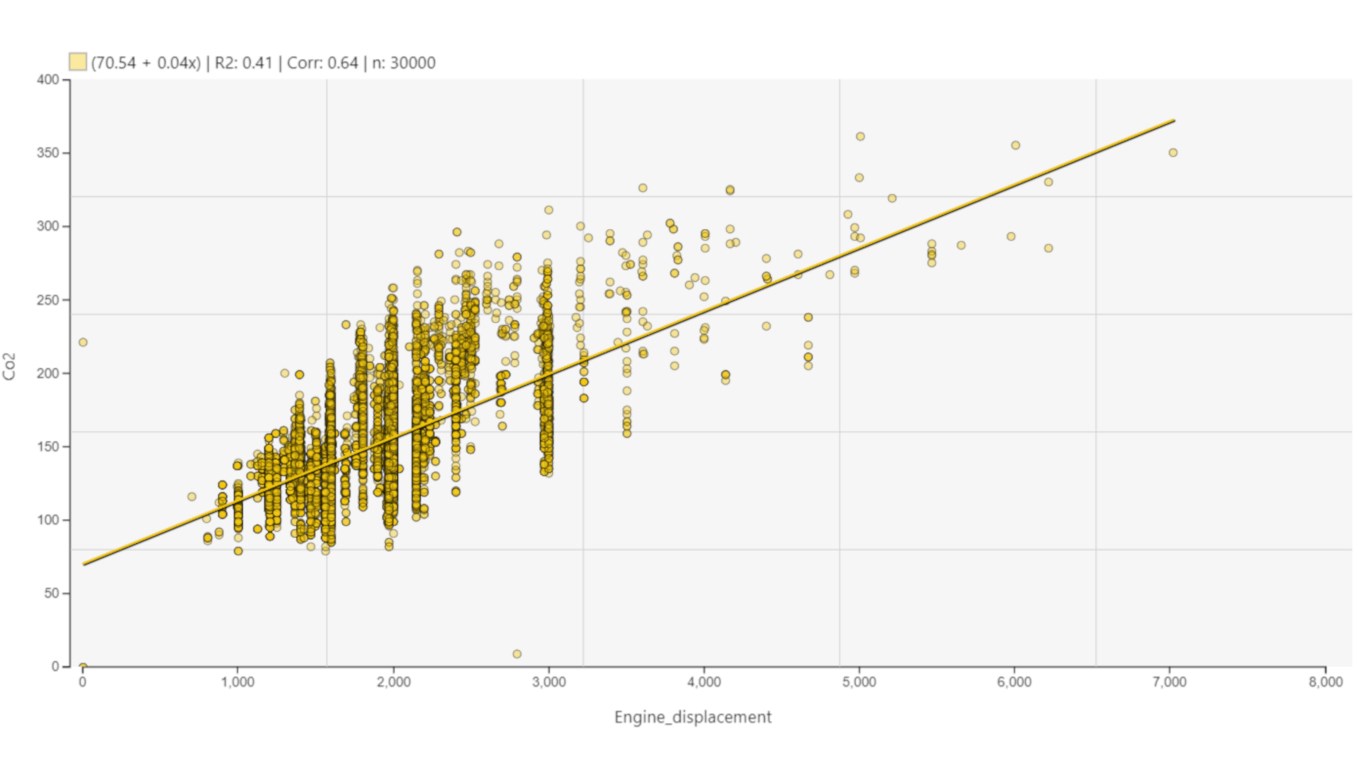
Craydec's Regression Chart can handle large datasets and you can explore & report them with multiple attributes by using small multiples (facets). It also includes dynamic data loading, which means that waiting time is minimal. Visual also includes speed mode rendering, which renders 10.000+ rows of data with ease. It does not aggregate your data, unless you want to.
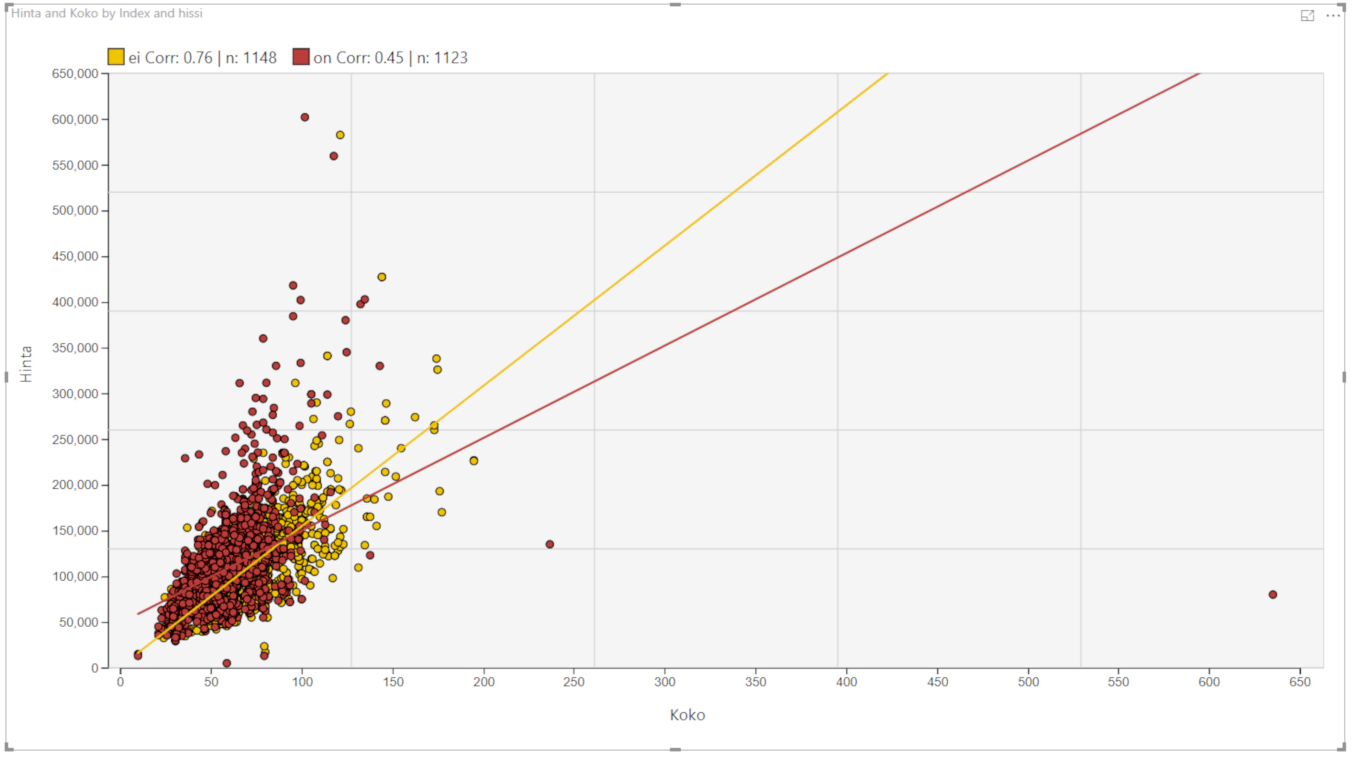
Craydec Regression chart is a scatter chart / scatter plot with a simple linear regression. The visual calculates Pearson's correlation coefficient, R2 value, and it draws the correlation equation as abline on the chart.
With a license you can release the true power of the visual. Get your license from our store: https://www.craydec.com/regression-chart
---
What do you get with a license?
- No limits for data size (Power BI limits to 30.000 lines)
- Label for small multiples
- Assign custom colors & opacity for groups
- Selection of multiple data points
---
What's new in 1.1.1?
- Fast rendering (speed) updated to Chrome changes.
- Aggregated data is displayed.
- Fix: some data points caused visual to hang.
Capacidades visuales
Cuando se usa este objeto visual,
- Puede acceder a servicios o recursos externos.
De un vistazo

Other aplicaciones de Craydec Oy
Craydec TimelinesCraydec Oy Power BI visualsVisualize dates and times (or numbers) with gantt or rote style. Simple. Effective. Easy to use.
Applicable to:Power BI visuals
NaN out of 2
Craydec Control ChartsCraydec OyPower BI visualsControl charts for Power BI. Analyze & track your processes and see whether they are in control.
Applicable to:Power BI visuals
NaN out of 2
Al obtener este producto, concede permiso a Microsoft para usar o compartir la información de mi cuenta para que el proveedor pueda ponerse en contacto conmigo con respecto a este producto y productos relacionados. Acepto los términos de uso y la directiva de privacidad del proveedor y entiendo que los derechos para usar este producto no proceden de Microsoft, a menos que Microsoft sea el proveedor. El uso de AppSource se rige por términos y privacidad independientes.