Filtros
Examinar aplicaciones
Filtrar y ordenar ofertas para restringir los resultados.

Adobe Acrobat for Microsoft 365Adobe SaaSDo more with PDFs – it’s Acrobat built right into popular Microsoft enterprise apps.
+complementos incluidos
Applicable to:SaaS
1 out of 60

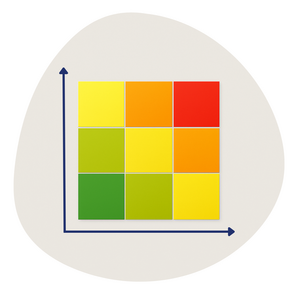
Risk Matrix / Heatmap - LeapLyticsLeapLytics GmbH Power BI visualsWith our Risk Matrix Visual, you turn overlooked reports into career-defining wins.
Applicable to:Power BI visuals
2 out of 60


Sankey DiagramVisioChartPower BI visualsVisualize your complex data flow patterns with Power BI's Sankey Diagram by VisioChart
Applicable to:Power BI visuals
3 out of 60

Mapspbi-consultantsPower BI visualsDiscover the ultimate interactive map visual that combines point, shape, and flow mapping.
Applicable to:Power BI visuals
4 out of 60

ChatGPT for MS WordAPPS DO WONDERS LLC WordBest AI Writing Assistant & Editor. Write and edit with AI.
Applicable to:Word
5 out of 60

ChatGPT for PowerPointAPPS DO WONDERS LLC PowerPointAI Presentation Maker. Make Magic. Not Slides.
Applicable to:PowerPoint
6 out of 60

HTML Content (lite)Daniel Marsh-PatrickPower BI visualsVisualise column or measure values as HTML in your Power BI reports.
Applicable to:Power BI visuals
7 out of 60
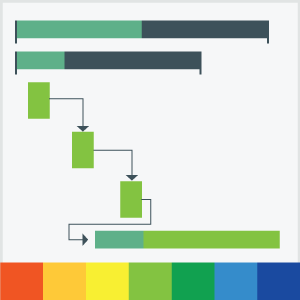
Gantt Chart - xVizxViz LLC dba LumelPower BI visualsProject management chart to monitor timeline, tasks, roadmaps, milestones, dependencies, resources!
Applicable to:Power BI visuals
8 out of 60

Formula Bot | AI in SpreadsheetsFormula Bot (Datasetmatch LLC) ExcelRevolutionize your analytics workflow, from formula generation to data automation.
Applicable to:Excel
9 out of 60
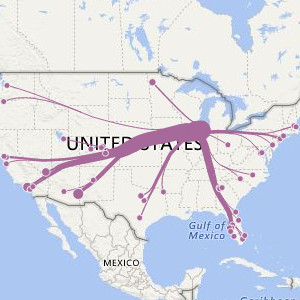
Flow mapWeiwei CuiPower BI visualsFlow-style visualization that depicts movements of objects among geo-locations
Applicable to:Power BI visuals
10 out of 60

Cisco Webex SchedulerCisco Webex OutlookSchedule, start, and join Cisco Webex meetings and Personal Room meetings.
Applicable to:Outlook
11 out of 60

Rosie AI - ChatGPT for ExcelRowsie AIExcelRosie: Your AI Excel expert
Applicable to:Excel
12 out of 60

RefWorks Citation ManagerClarivateWordAccess your references when writing for quick formatting of citations and bibliography.
Applicable to:Word
13 out of 60

Bubble / Scatter Chart - xVizxViz LLC dba LumelPower BI visualsUse Advanced Analytics for Correlation Analysis: Alerting, Trend Lines, Ranking & More!
Applicable to:Power BI visuals
14 out of 60

Performance Flow - xVizxViz LLC dba LumelPower BI visualsBuild interactive process, hierarchy and network diagrams in Power BI with alert-driven KPIs
Applicable to:Power BI visuals
15 out of 60
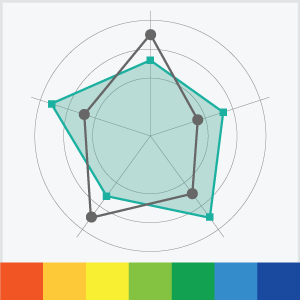
Radar/Polar Chart - xVizxViz LLC dba LumelPower BI visuals360-degree data comparison with 10+ series types, 10+ chart configurations, and advanced formatting
Applicable to:Power BI visuals
16 out of 60

WritefullWritefull BVWordWritefull is automated proofreading for science.
Applicable to:Word
17 out of 60

Filter by PowervizTRUVIZ INCPower BI visuals(100% Free) Advanced Filter with Default Selection, Hierarchy Control, Image Styling, Themes, etc...
Applicable to:Power BI visuals
18 out of 60

Pareto by sio2Graphssio2GraphsPower BI visualsClearly visualize which factors are having the greatest impact and driving business processes.
Applicable to:Power BI visuals
19 out of 60

Mailsuite for OutlookMailsuite S.L.OutlookEmail tracker for Outlook. Free and unlimited email tracking.
Applicable to:Outlook
20 out of 60
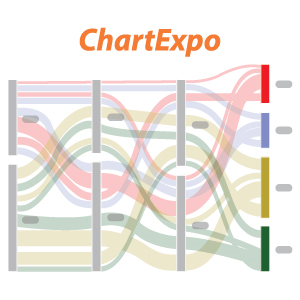
Sankey Diagram for Power BI by ChartExpopolyvista.comPower BI visualsFind out why 450,000+ users love ChartExpo. Experience the ChartExpo Sankey Diagram Difference.
Applicable to:Power BI visuals
21 out of 60

Use DynamicsAbakion Business CentralEasy Access to hundreds of free video user guides for Microsoft Dynamics 365 Business Central
Applicable to:Business Central
22 out of 60

Plus AI For PowerPointPlus Docs IncPowerPointAI PowerPoint Generator. Create, edit, and format slides in minutes. Try Plus AI for free!
Applicable to:PowerPoint
23 out of 60

Enlighten AquariumENLIGHTEN DESIGNSPower BI visualsMake dashboards fun with this award-winning Aquarium visualization
Applicable to:Power BI visuals
24 out of 60

Bullet Chart by OKVIZOKVIZ Corp.Power BI visualsShowcase performance vs. targets with precision using the best Bullet Chart for Power BI!
Applicable to:Power BI visuals
25 out of 60

Simple WaterfallDATANOMY TECHNOLOGIES LIMITEDPower BI visualsDefine waterfall pillars | Advance Formatting | Fully customisable | Drillable |
Applicable to:Power BI visuals
26 out of 60

Advanced Gauge - xVizxViz LLC dba LumelPower BI visualsCompare Actual vs. Target with Dual-Axis & Color-Coded Alerts for upto 2 KPIs!
Applicable to:Power BI visuals
27 out of 60
Based On Your Timeline SlicerBased OnPower BI visualsYour Timeline Slicer – The Space-Saving Timeline Visual for Power BI
Applicable to:Power BI visuals
28 out of 60


Exclaimer Cloud for OutlookExclaimer LimitedOutlookOutlook Add-In: Create and centrally manage professional email signatures for all users on M365
Applicable to:Outlook
29 out of 60
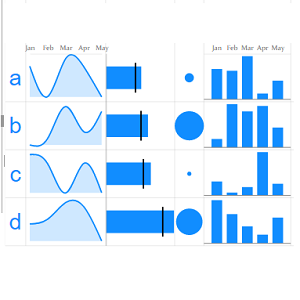
Multiple SparklinesExcelnaccess.comPower BI visualsTransform your Table Data/ Numbers into Charts for stunning visual insights
Applicable to:Power BI visuals
30 out of 60

Multi Info CardsPortfolio Consultoria EmpresarialPower BI visualsShow your data in multiple cards, each one with a category, an optional image and multiple measures
Applicable to:Power BI visuals
31 out of 60

Read AIRead AI, Inc. TeamsAI-generated meeting summaries and transcripts supercharged with enterprise search from Read AI
Applicable to:Teams
32 out of 60

ClickUp for OutlookClickUpOutlookQuickly turn Outlook emails into tasks on the #1 rated productivity platform.
Applicable to:Outlook
33 out of 60
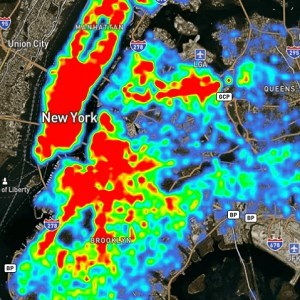
Mapbox Custom VisualStarschema Kereskedelmi es Szolgaltato Korlatolt Felelossegu TarsasagPower BI visualsNext gen maps. Create heatmaps, shape maps, circles, and clusters using big location data.
Applicable to:Power BI visuals
34 out of 60

Water CupDaniel Szentimrey-HarrachPower BI visualsNiche visual for infographics comparing items across up to 4 dimensions.
Applicable to:Power BI visuals
35 out of 60

ShareFileProgress Software CorporationOutlookSecurely share, receive, and save files using ShareFile integration in Outlook.
Applicable to:Outlook
36 out of 60
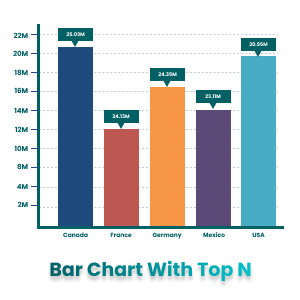
Bar Chart With Top N SelectionOffice SolutionPower BI visualsSelect Top N number of items to be displayed in chart and rest items will be clubbed as others
Applicable to:Power BI visuals
37 out of 60

Drill Down Pie PRO (Filter) by ZoomChartsZoomChartsPower BI visualsEnjoy interactive drilldowns, user friendly navigation and beautiful design.
Applicable to:Power BI visuals
38 out of 60

Advanced Toggle Switch by TME AGTME AGPower BI visualsShow and hide multiple data fields with switch on/off
Applicable to:Power BI visuals
39 out of 60
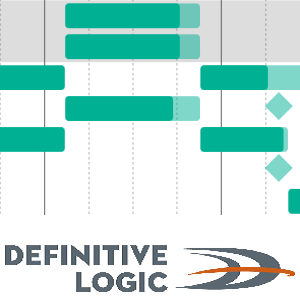
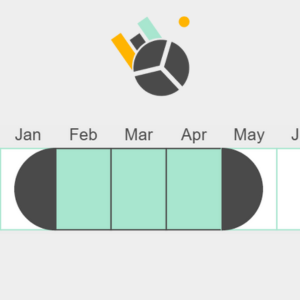
Definitive Logic Advanced Gantt ChartDefinitive LogicPower BI visualsA Gantt Chart with task swim lanes and advanced customization
Applicable to:Power BI visuals
40 out of 60

ChartExpo™ for Excelpolyvista.comExcelSelect a chart, select your data, and create Insightful charts without hardwork!
Applicable to:Excel
41 out of 60
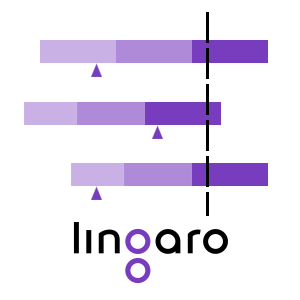
GANTT by LingaroLingaroPower BI visualsTrack all your projects with full visibility of every phase and milestone!
Applicable to:Power BI visuals
42 out of 60

HierarchySlicerDataScenariosPower BI visualsCreate a hierarchy of different fields and use it as a slicer with Power BI.
Applicable to:Power BI visuals
43 out of 60

Box and Whisker chartDataScenariosPower BI visualsVisualize a dataset in an effective way as a five-number summary (mean, median, quartiles, min/max)
Applicable to:Power BI visuals
44 out of 60

AI Agent for ExcelMatrix LeadExcelAn autonomous agent in Excel to handle spreadsheet work on your behalf—You assign. AI executes.
Applicable to:Excel
45 out of 60

AhaSlides - Live Polls & QuizzesAhaSlidesPowerPointAhaSlides - The Power of Engagement!
Applicable to:PowerPoint
46 out of 60

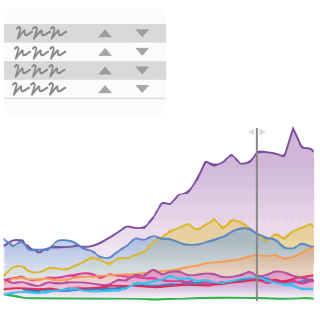
decomposition_treeExcelnaccess.comPower BI visualsDecomposition tree visual lets you visualize data across multiple dimensions
Applicable to:Power BI visuals
47 out of 60

Zebra BI CardsZebra BIPower BI visualsInsanely flexible KPI scorecards. Multi-cards with variances, sparklines, comments, drill-through.
Applicable to:Power BI visuals
48 out of 60
Multi Line Chart with TooltipsDatanautsPower BI visualsThe Multi Line Chart packed with features that puts the joy in time series analysis
Applicable to:Power BI visuals
49 out of 60

Tachometer by E&AEarnest and AssociatesPower BI visualsTachometer which allows for 7 ranges.
Applicable to:Power BI visuals
50 out of 60
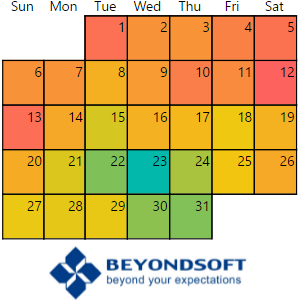
Beyondsoft CalendarManny MerinoPower BI visualsVisualize your monthly data and assign custom colors with this dynamic, data-driven calendar visual.
Applicable to:Power BI visuals
51 out of 60

Image GridFredrik HedenströmPower BI visualsVisualize images in Power BI.
Applicable to:Power BI visuals
52 out of 60

Jira Cloud for ExcelAtlassian.comExcelExport Jira data to Excel - Combine the power of Jira with the flexibility of Excel
Applicable to:Excel
53 out of 60

BoomerangBaydin Inc.Outlook#1 meeting scheduling and email productivity tool. Inbox calendar scheduling and email management.
Applicable to:Outlook
54 out of 60
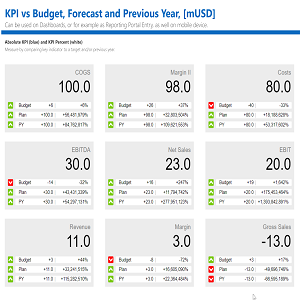
Ultimate KPI Carddataviz.boutique GmbHPower BI visualsShows a value, its variance to a reference value and its variance to 2nd or 3rd refetence value.
Applicable to:Power BI visuals
55 out of 60

DeepL for OutlookDeepLOutlookAI Translator and Writing Assistant
Applicable to:Outlook
56 out of 60

Trello for TeamsAtlassian.com Office appOutlookTeamsTrello for Microsoft lets you work more collaboratively and get more done.
Applicable to:Office appOutlookTeams
57 out of 60

Adobe Acrobat for Microsoft Word, Excel, and PowerPointADOBE INC.ExcelPowerPointWordDo more with enterprise PDF tools, built right into your favorite Microsoft 365 apps.
ver opciones de paquete
Applicable to:ExcelPowerPointWord
58 out of 60

Selection Slicer by Walnut InnovationWalnut Innovation LimitedPower BI visualsMulti-category slicer/filter showing selected and unavailable choices
Applicable to:Power BI visuals
59 out of 60

SAP Analytics Cloud for ExcelSAP SEExcelUse Microsoft Excel’s strengths to get deeper insights into your SAP Analytics Cloud data.
Applicable to:Excel
60 out of 60