Precios Gratis
Interactive Visualizations with Datawrapper
por Datawrapper GmbH
Adds support for embedding interactive Datawrapper charts, maps, and tables.
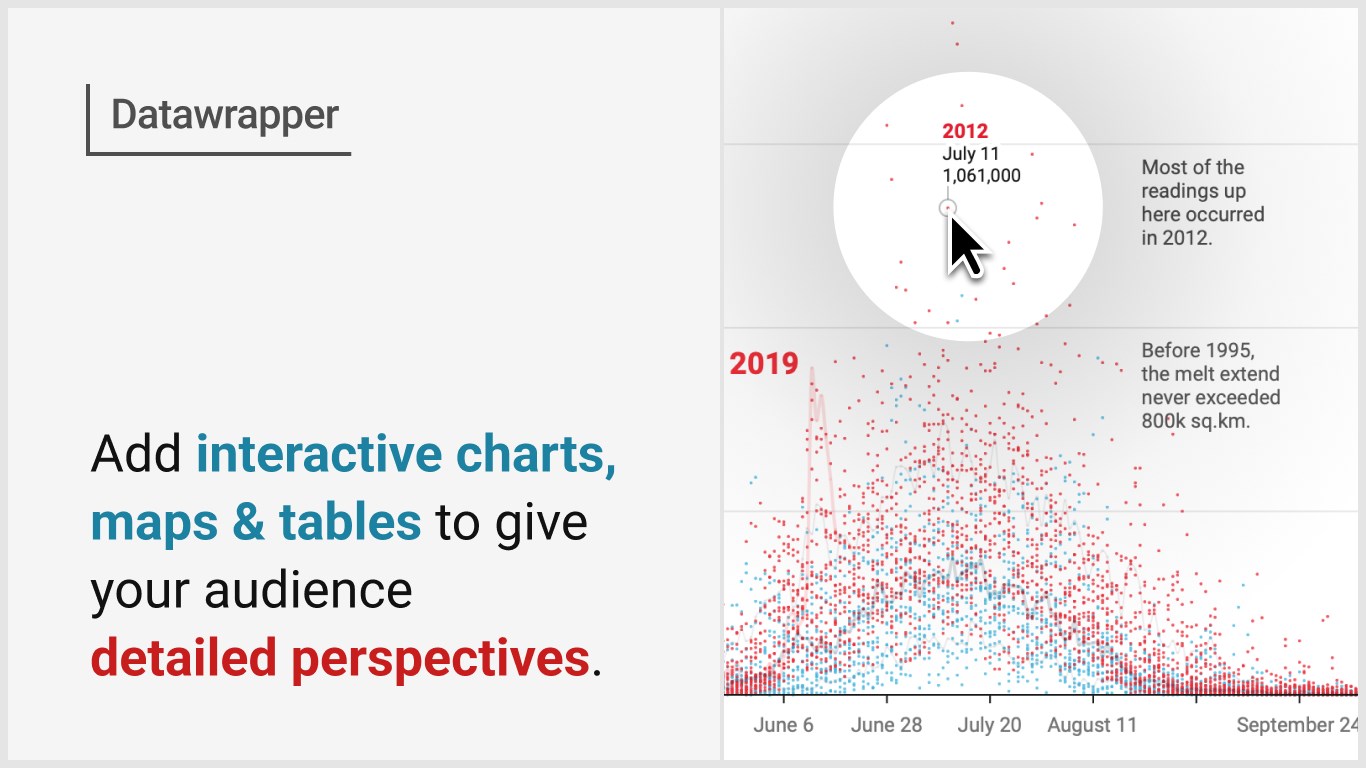
Embed Datawrapper visualizations with support for interactivity, like tooltips or zoomable maps, directly in your presentations.
To edit and create new visualizations directly in PowerPoint, please also install the other add-in called “Datawrapper: Charts, Maps & Tables.”
About Datawrapper
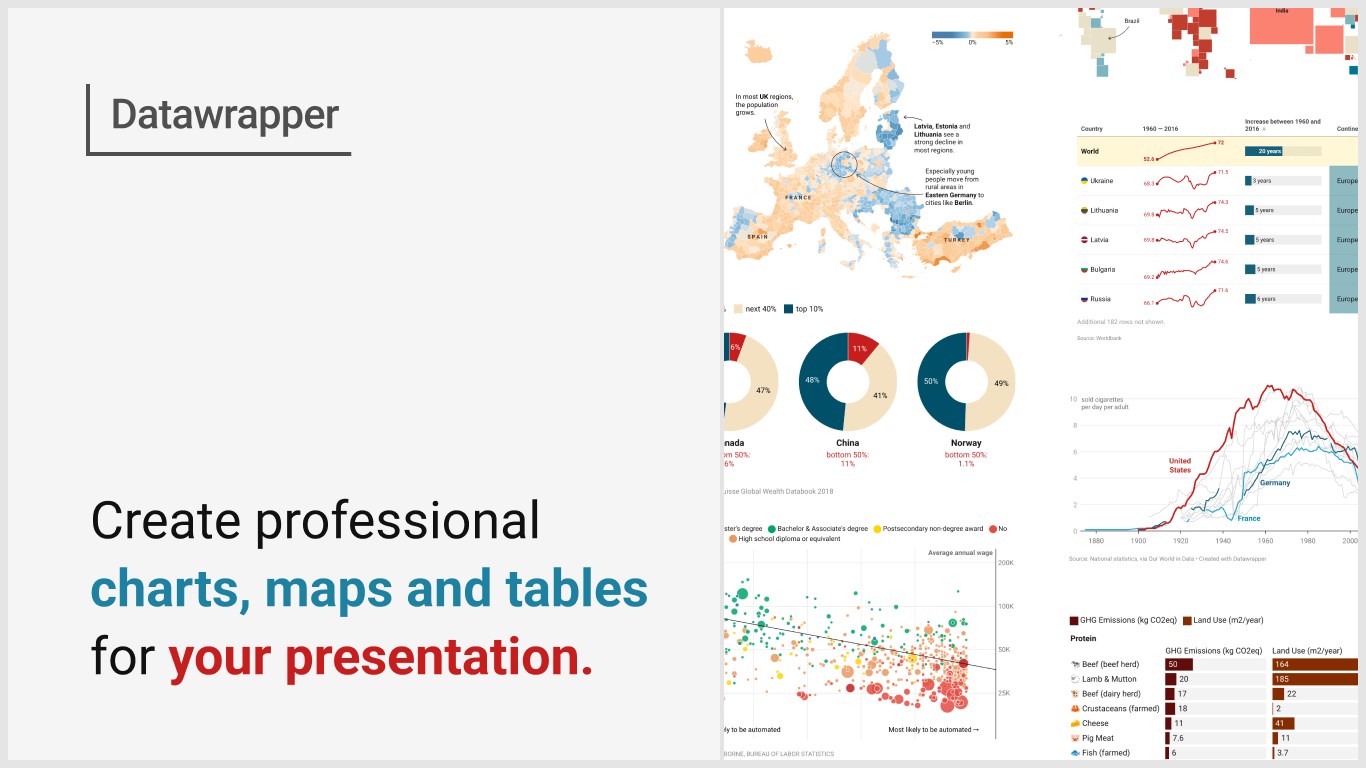
Create beautiful data visualizations with the online tool Datawrapper — no code or design skills required. In only a few simple steps you can get from your raw data to stunning charts, maps or tables.
Charts
Use one of 20+ interactive and responsive chart types ranging from simple bars and lines to arrow, range, and scatter plots.
Maps
Three interactive and responsive map types let you create anything from locator maps to thematic choropleth and symbol maps.
Tables
Responsive data tables allow for lots of styling options and let you include bar, column, and line charts, heatmaps, images, a search bar, and pagination.
Requirements
To embed a visualization, publish it in Datawrapper and copy & paste the public URL.
Using Datawrapper requires a free account.
Funcionalidades de la aplicación
Cuando se usa esta aplicación,
- Puede leer el documento y hacer cambios
- Puede enviar datos por Internet
De un vistazo
By getting this product, I give Microsoft permission to use or share my account information so that the provider can contact me regarding this product and related products. I agree to the provider's términos de uso and directiva de privacidad and understand that the rights to use this product do not come from Microsoft, unless Microsoft is the provider. Use of términos is governed by separate privacidad and {4}.