
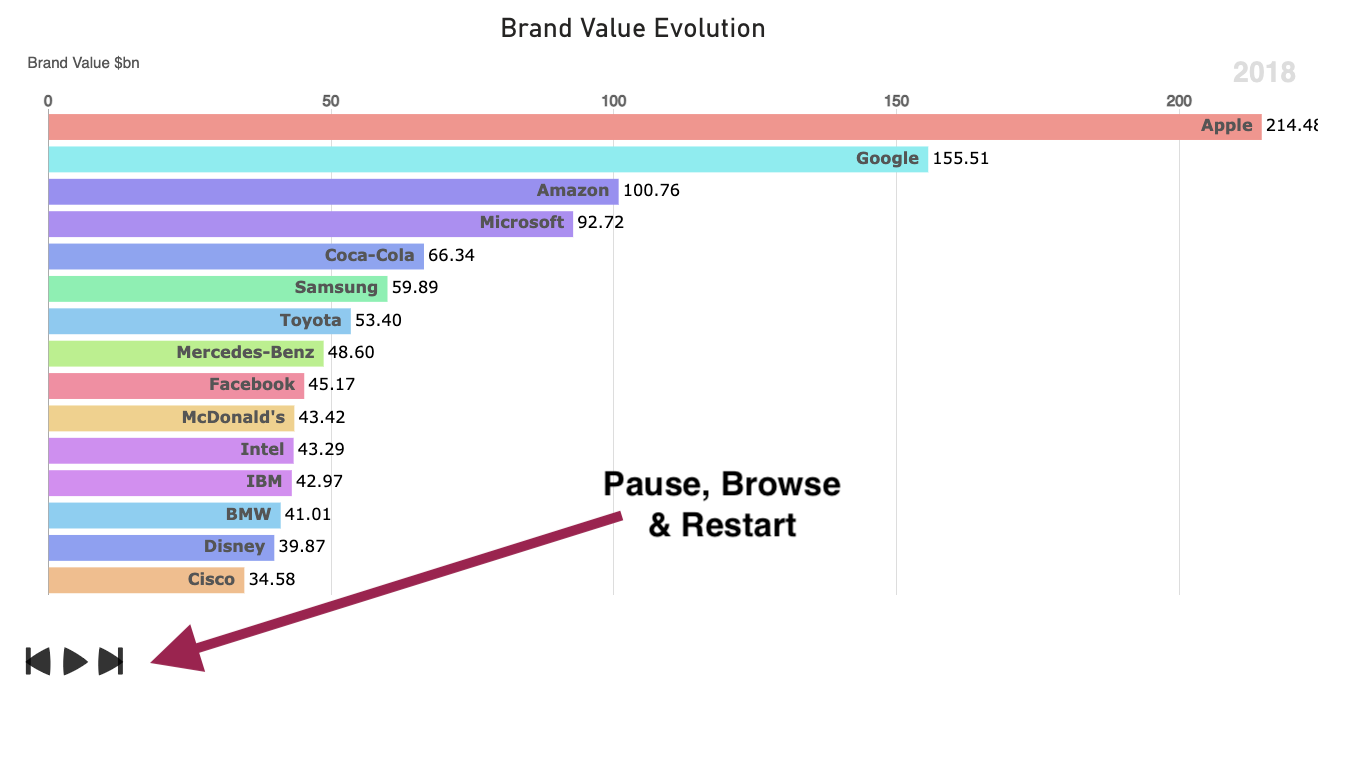
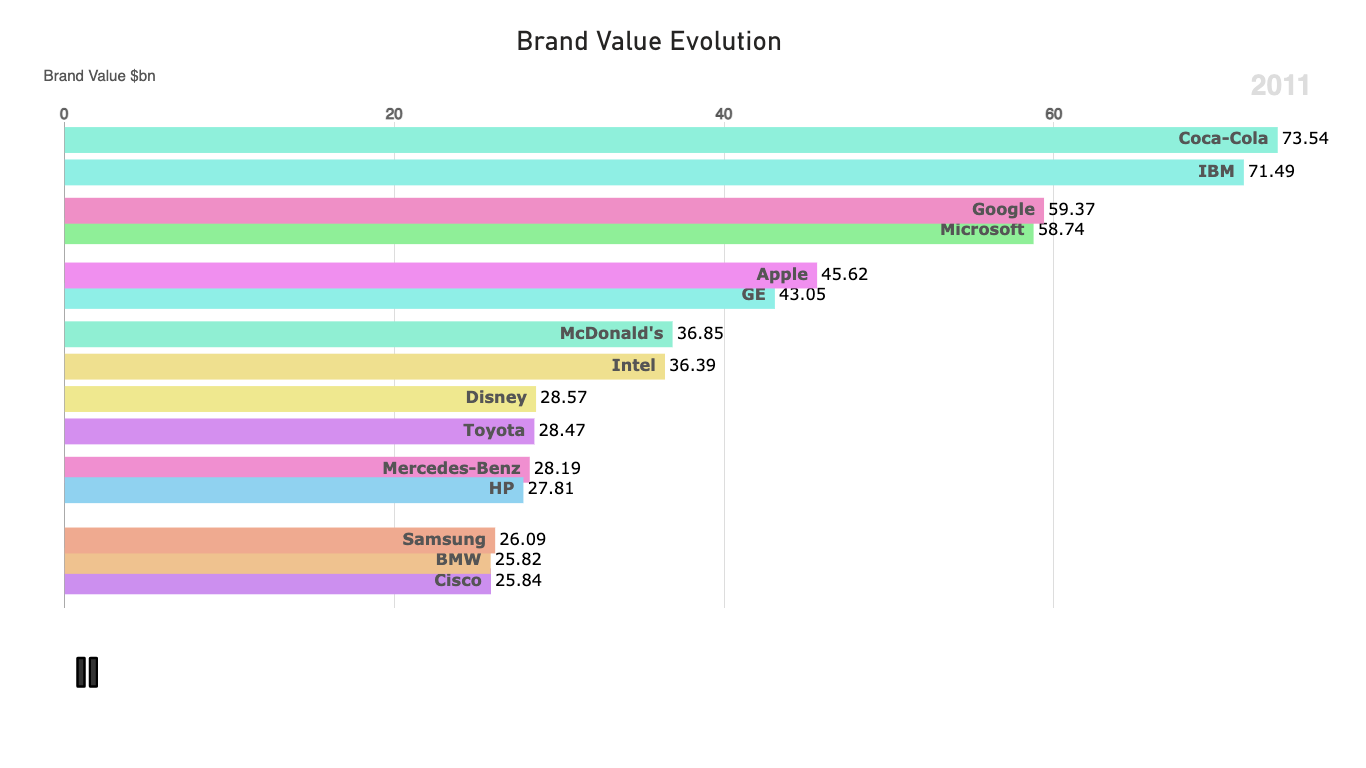
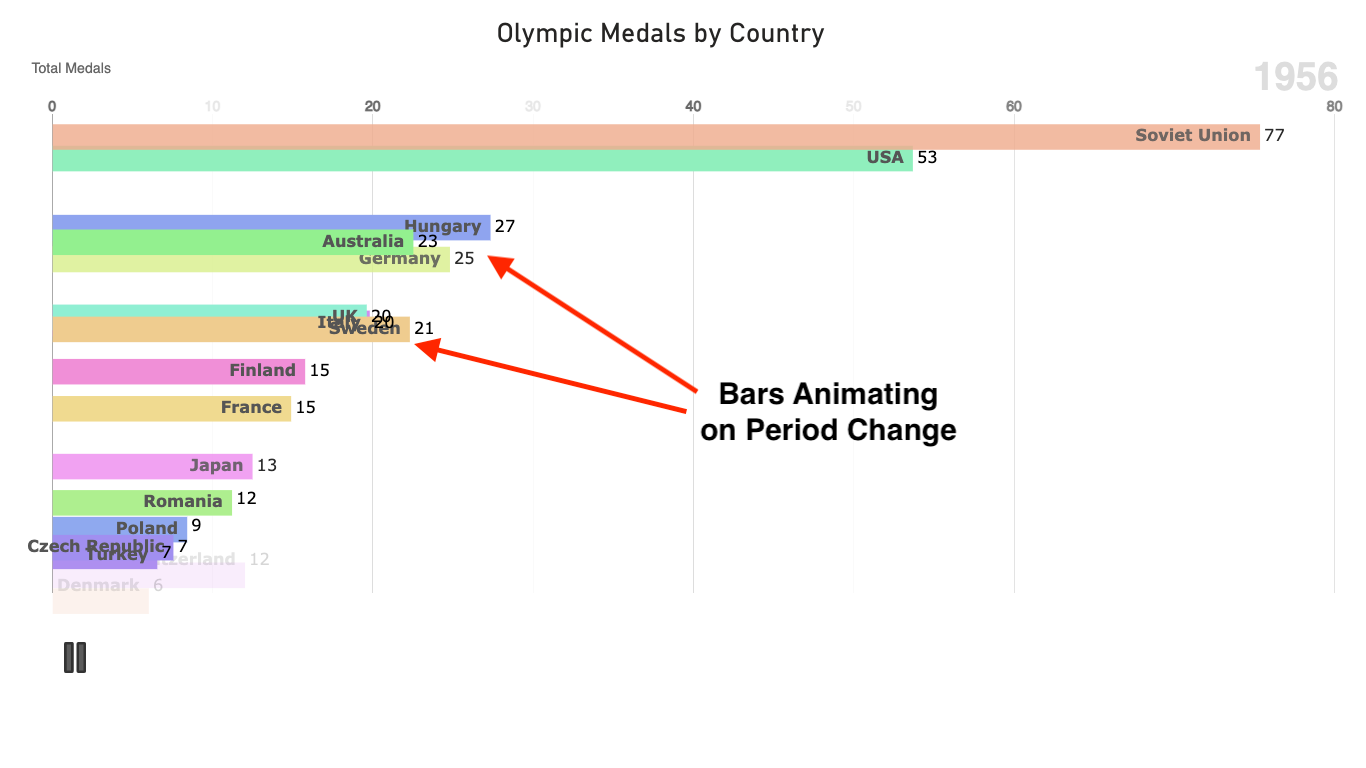
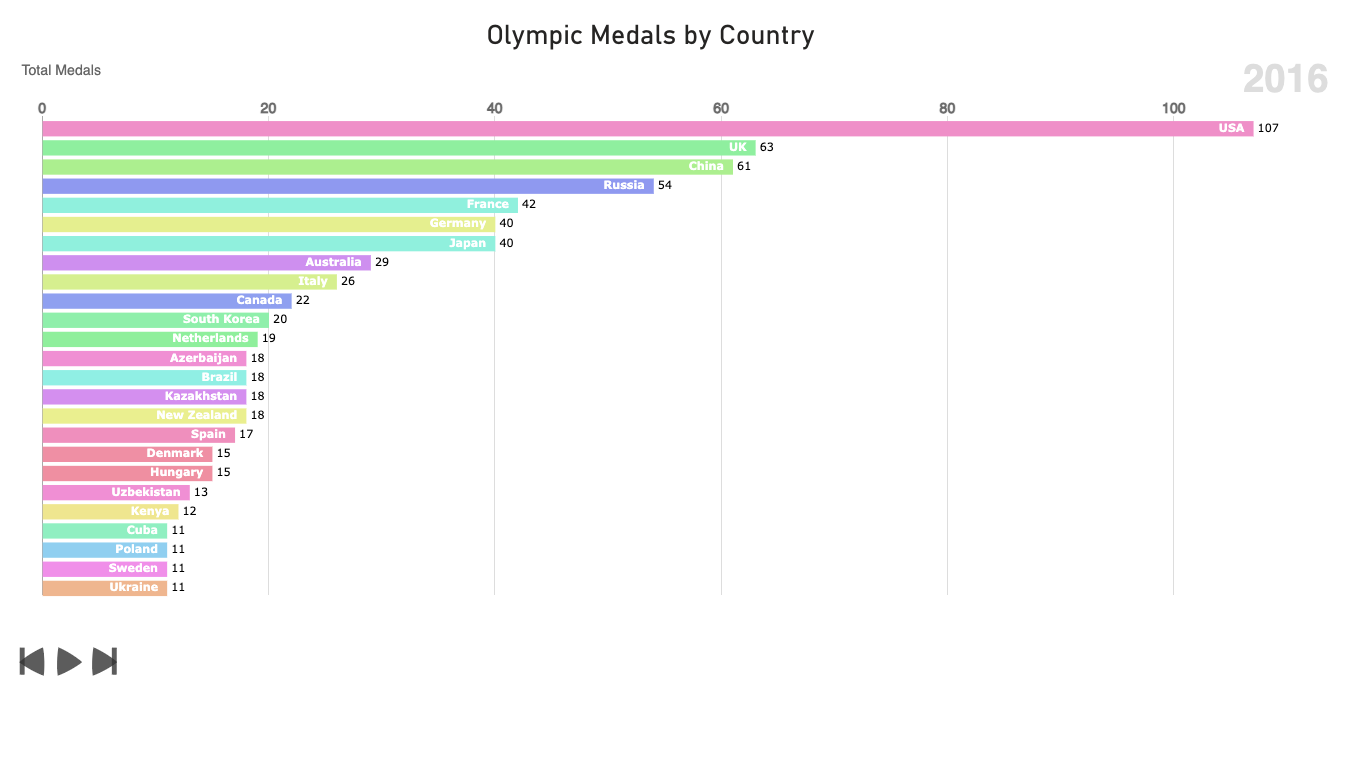
Animated Bar Race Chart
por INOVISTA LIMITED
Bars are plotted and sorted continuously as they progress through a range of periods.
Highlights
- The chart presents a typical bar chart but offers the capability of animating the bars through periods such as time. The bars resize and relocate for each period.
- A user can pause the animation at any point and can then restart the animation or browse to the next or previous period.
- Values are shown at the end of each bar.
- A variety of properties are available to the designer which include adjustment of point and period change durations, show/hide pause panel, font/color editing and the number of bar items to be shown.
This custom visualization was generated by the Inovista Animator. A custom image is loaded into the Animator where additional animations can be added, the resultant image is then exported as a Power BI visual. Find out more at: https://www.inovista.com
Capacidades visuales
Cuando se usa este objeto visual,
- Puede acceder a servicios o recursos externos.
De un vistazo

Other aplicaciones de INOVISTA LIMITED
Animator for Power BIINOVISTA LIMITEDCreate custom, data-driven chart and infographic animations based on any SVG image.
+1
Applicable to: Power BI visuals
NaN out of 2
Animated Image and Bubble ChartINOVISTA LIMITEDAn animated bubble chart that can also use images. The animation can be paused and restarted.
+1
Applicable to:Power BI visuals
NaN out of 2