筛选器
浏览应用
对优惠进行筛选和排序,优化结果。

draw.ioJGraph Ltd TeamsEnable visual collaboration on simple sketches and complex diagrams in Microsoft Teams
Applicable to:Teams
1 out of 60


Data Recovery ToolBLR Tools SaaSBest Data Recovery Tool to Recover Lost Data, Formatted Data drive SSD, HDD, Pen Drive and SD card
Applicable to:SaaS
2 out of 60

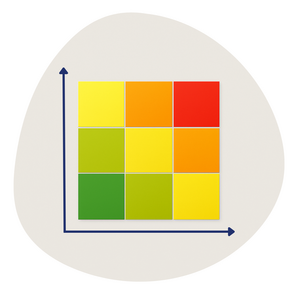
Risk Matrix / Heatmap - LeapLyticsLeapLytics GmbH Power BI visualsRisk Matrix: Our Solution for Professionals
Applicable to:Power BI visuals
3 out of 60

Shared Email TemplatesAdd-in Express OutlookShared templates for Outlook emails, calendar events, and signatures + mail merge
Applicable to:Outlook
4 out of 60

GenText AI AssistantGentext Group Inc. WordGenText is an AI Assistant to help academics write reports and cite research accurately
Applicable to:Word
5 out of 60
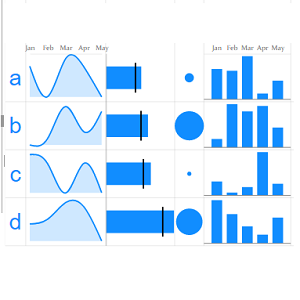
Multiple SparklinesExcelnaccess.comPower BI visualsTransform your Table Data/ Numbers into Charts for stunning visual insights
Applicable to:Power BI visuals
6 out of 60

WikipediaMicrosoft Corporation ExcelWordFind and quote related information from Wikipedia.
Applicable to:ExcelWord
7 out of 60

Visio VisualMicrosoft CorporationPower BI visualsBring your business activities to life in ways that only Microsoft Visio diagrams can visualize
Applicable to:Power BI visuals
8 out of 60

People GraphMicrosoft CorporationExcelTransform cold data into a cool picture.
Applicable to:Excel
9 out of 60
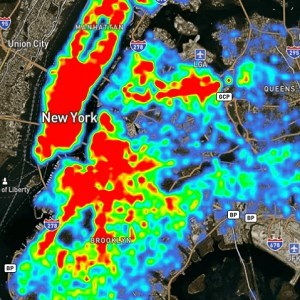
Mapbox Custom VisualStarschema Kereskedelmi es Szolgaltato Korlatolt Felelossegu TarsasagPower BI visualsNext gen maps. Create heatmaps, shape maps, circles, and clusters using big location data.
Applicable to:Power BI visuals
10 out of 60

Kutools for OutlookExtendOffice LtdOutlookAdvanced AI tools to streamline email management and boost productivity.
Applicable to:Outlook
11 out of 60


ti&m places - Desk booking - Room booking - Hybrid workti&m AGSaaSReserve desks, meeting rooms, and parking spaces with the hybrid work app for Microsoft Teams.
+包含的加载项
Applicable to:SaaS
12 out of 60

Power BIMicrosoft Corporation Office appOutlookTeamsCollaborate better with your data.
Applicable to:Office appOutlookTeams
13 out of 60

Multi Info CardsPortfolio Consultoria EmpresarialPower BI visualsShow your data in multiple cards, each one with a category, an optional image and multiple measures
Applicable to:Power BI visuals
14 out of 60

Jira Cloud for Outlook (Official)Atlassian.comOutlookOrganize your team’s work without leaving your inbox
Applicable to:Outlook
15 out of 60

HierarchySlicerDataScenariosPower BI visualsCreate a hierarchy of different fields and use it as a slicer with Power BI.
Applicable to:Power BI visuals
16 out of 60

Microsoft Project Web AppMicrosoft Power BI appsUnlock insight from Project Web App to help manage projects, portfolios and resources.
Applicable to:Power BI apps
17 out of 60

Bing MapsMicrosoft CorporationExcelThe Bing Maps add-in makes it easy to plot locations and visualize your data through Bing Maps in Excel
Applicable to:Excel
18 out of 60
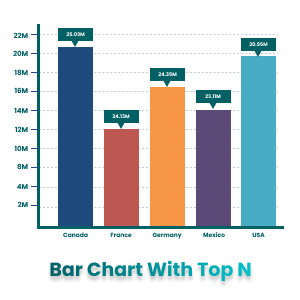
Bar Chart With Top N SelectionOffice SolutionPower BI visualsSelect Top N number of items to be displayed in chart and rest items will be clubbed as others
Applicable to:Power BI visuals
19 out of 60

AnacondaToolboxAnaconda, IncExcelAnaconda Toolbox for Excel
Applicable to:Excel
20 out of 60

Drill Down Pie PRO (Filter) by ZoomChartsZoomChartsPower BI visualsEnjoy interactive drilldowns, user friendly navigation and beautiful design.
Applicable to:Power BI visuals
21 out of 60
Definitive Logic Advanced Gantt ChartDefinitive LogicPower BI visualsA Gantt Chart with task swim lanes and advanced customization
Applicable to:Power BI visuals
22 out of 60

Image GridFredrik HedenströmPower BI visualsVisualize images in Power BI.
Applicable to:Power BI visuals
23 out of 60

Adobe Acrobat for Microsoft Word, Excel, and PowerPointADOBE INC.Excel PowerPointWordDo more with enterprise PDF tools, built right into your favorite Microsoft 365 apps.
查看包选项
Applicable to:ExcelPowerPointWord
24 out of 60

Box and Whisker chartDataScenariosPower BI visualsVisualize a dataset in an effective way as a five-number summary (mean, median, quartiles, min/max)
Applicable to:Power BI visuals
25 out of 60

ChatGPT ConnectoriEnterprisesOutlookUltimate AI tool that allows you to automatically compose emails, answer emails, translate messages
Applicable to:Outlook
26 out of 60

HeyGenSurreal Technology Inc.SaaSThe best AI video generation platform for your team
Applicable to:SaaS
27 out of 60

Power BI Apps on AppSource - Exploration ToolDataChantPower BI appsAnalyze and explore all of the Power BI apps on AppSource within a Power BI App
Applicable to:Power BI apps
28 out of 60

Advanced Toggle Switch by TME AGTME AGPower BI visualsShow and hide multiple data fields with switch on/off
Applicable to:Power BI visuals
29 out of 60

GANTT by LingaroLingaroPower BI visualsTrack all your projects with full visibility of every phase and milestone!
Applicable to:Power BI visuals
30 out of 60
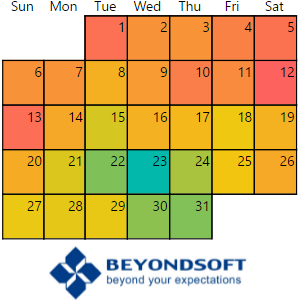
Beyondsoft CalendarManny MerinoPower BI visualsVisualize your monthly data and assign custom colors with this dynamic, data-driven calendar visual.
Applicable to:Power BI visuals
31 out of 60
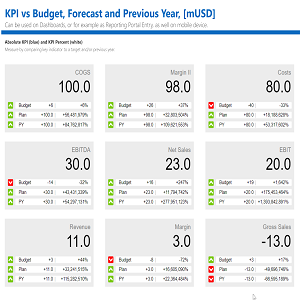
Ultimate KPI Carddataviz.boutique GmbHPower BI visualsShows a value, its variance to a reference value and its variance to 2nd or 3rd refetence value.
Applicable to:Power BI visuals
32 out of 60

Clio's Outlook Add-inClioOutlookSave your emails, record time and manage your inbox.
Applicable to:Outlook
33 out of 60

FormsMicrosoft CorporationPowerPointEmbed surveys, quizzes, and polls directly into a PowerPoint slide.
Applicable to:PowerPoint
34 out of 60

Filter by ListDEVSCOPEPower BI visualsApply filter values to a report in bulk instead of individually checking each box in the filter pane
Applicable to:Power BI visuals
35 out of 60


Helpdesk 365Apps 365 & HR365 SharePointHelpdesk 365 IT, HR and Finance Ticketing System for Microsoft 365
查看包选项
Applicable to:SharePoint
36 out of 60

Zebra BI CardsZebra BIPower BI visualsInsanely flexible KPI scorecards. Multi-cards with variances, sparklines, comments, drill-through.
Applicable to:Power BI visuals
37 out of 60
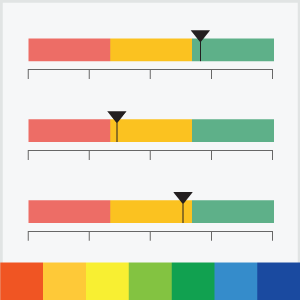
Linear Gauge - xVizxViz LLCPower BI visualsVisualize your KPIs to track its progress against key metrics with Custom labels, ranges and limits!
Applicable to:Power BI visuals
38 out of 60

Financial Reporting Matrix by ProfitbaseProfitbase ASPower BI visualsEasily build financial reports with line formatting, conditional formatting, subtotals and more.
Applicable to:Power BI visuals
39 out of 60

Tachometer by E&AEarnest and AssociatesPower BI visualsTachometer which allows for 7 ranges.
Applicable to:Power BI visuals
40 out of 60
Google Maps for Power BIDynamica Labs LTDPower BI visualsGoogle Maps for Power BI is a visual that helps display and analyze data on Google Maps.
Applicable to:Power BI visuals
41 out of 60

Heatmap VisualDEFTEAM SOLUTIONS PRIVATE LIMITEDPower BI visualsVisualizing multidimensional data using Heatmap Visual
Applicable to:Power BI visuals
42 out of 60
Multi target KPIAlex KolokolovPower BI visualsCrisp-n-clear visualization for your KPIs!
Applicable to:Power BI visuals
43 out of 60
Multi Line Chart with TooltipsDatanautsPower BI visualsThe Multi Line Chart packed with features that puts the joy in time series analysis
Applicable to:Power BI visuals
44 out of 60

AI-aided Formula EditorMatrix LeadExcelAll-in-One AI Solution for Formulas and Spreadsheets in Excel
Applicable to:Excel
45 out of 60

BreaktimeFlow Simulation Ltd.PowerPointA quick way to tell everyone when you'll be back, because it's Breaktime!
Applicable to:PowerPoint
46 out of 60

DeepL for OutlookDeepLOutlookAI Translator and Writing Assistant
Applicable to:Outlook
47 out of 60

QuillBotKeuji CoWordSave time and immediately improve your writing with QuillBot’s Paraphrasing and Summarizing Tool.
Applicable to:Word
48 out of 60

Zoho CRM for emailZoho Corporation Private LimitedOutlookPowerful, contextual CRM inside your mailbox
Applicable to:Outlook
49 out of 60

EndNote Cite While You Write for Word OnlineClarivateWordInsert in-text citations while simultaneously creating a bibliography with Cite While You Write
Applicable to:Word
50 out of 60

Violin PlotDaniel Marsh-PatrickPower BI visualsUse to visualise the distribution of your data.
Applicable to:Power BI visuals
51 out of 60

Visual CreatorMicrosoft CorporationOffice appTeamsCreate stunning visuals with Microsoft 365 Copilot
Applicable to:Office appTeams
52 out of 60

Timeline by QueryonQueryonPower BI visualsA single-axis timeline packed with features.
Applicable to:Power BI visuals
53 out of 60

Route mapWeiwei CuiPower BI visualsVisualize trajectories on a map
Applicable to:Power BI visuals
54 out of 60

Force-Directed GraphMicrosoft CorporationPower BI visualsForce layout diagram with curved path. Useful to show connections between entities
Applicable to:Power BI visuals
55 out of 60

Selection Slicer by Walnut InnovationWalnut Innovation LimitedPower BI visualsMulti-category slicer/filter showing selected and unavailable choices
Applicable to:Power BI visuals
56 out of 60

Hierarchy Chart by AkvelonAkvelonPower BI visualsShow any type of hierarchical data in a tree format such as organization and family trees
Applicable to:Power BI visuals
57 out of 60

Finance Power BI app for Business Central (26.2)MicrosoftPower BI appsVisualize aspects of your finance in Dynamics 365 Business Central
Applicable to:Power BI apps
58 out of 60

Minitab Statistical SoftwareMinitab, LLCSaaSMinitab Statistical Software gives you the tools you need to analyze your data
Applicable to:SaaS
59 out of 60

Acterys Gantt for Project ManagementManagilityPower BI visualsPlan, update, and manage projects effortlessly within Power BI using Acterys Gantt.
Applicable to:Power BI visuals
60 out of 60