
Show the flow of data from one category/process to another.
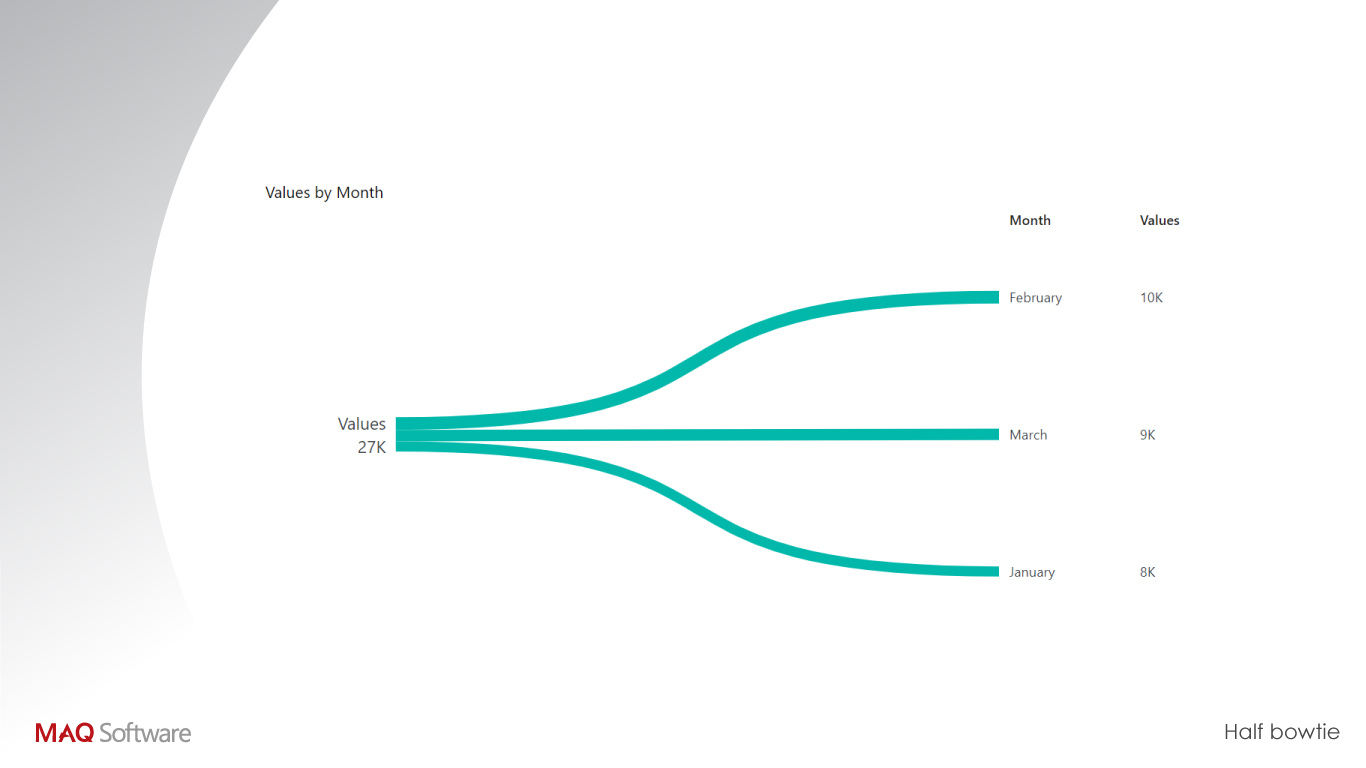
Use Bowtie Chart by MAQ Software to quickly compare values in one or more categories. Bowtie Chart by MAQ Software is ideal for displaying sales metrics, such as the flow of a sale from channel to category. The thickness of the bowtie's branches indicates the relative weight of each category. Create a full bowtie to showcase how a cumulative value splits into two distinct sub-categories. Alternately, you can create a half bowtie, showcasing the distribution of data within a source.
Business Uses:
- Risk Management – Compare mitigating factors against the consequences of a risk
- Sales – Break down sales by region and sub-region
- Customer service – Categorize problems by customer type
- Human Resources – Classify new hires over a period by hiring source and department
Key Features:
- Configurable branch color
- Configurable font size, color, and decimal precision for data labels and summary labels
- Configurable format (half bowtie or full bowtie)
- Interactive with other visuals
What's New in 4.0.1:
- Fixed summary label position
Contact Us:
Thank you for using Bowtie Chart by MAQ Software.
Do you have questions about this or any of our other Power BI custom visuals? Check out our community pages on Zendesk: http://bit.ly/maqpbivizfaq.
视觉对象功能
此视觉对象由 Power BI 认证
概览

来自 MAQ LLC 的其他应用

Gantt Chart by MAQ SoftwareMAQ LLC Power BI visualsGantt chart for effective project management | Power BI Certified
Applicable to:Power BI visuals
NaN out of 5
Box and Whisker chart by MAQ SoftwareMAQ LLCPower BI visualsEfficiently analyze and compare data distributions | Power BI Certified
Applicable to:Power BI visuals
NaN out of 5
Calendar by MAQ SoftwareMAQ LLCPower BI visualsStreamline event tracking in Power BI | Power BI Certified
Applicable to:Power BI visuals
NaN out of 5
Hierarchy Chart by MAQ SoftwareMAQ LLCPower BI visualsStreamline your organizational insights | Power BI Certified
Applicable to:Power BI visuals
NaN out of 5
Cylindrical Gauge by MAQ SoftwareMAQ LLCPower BI visualsVisualize targets with precision | Power BI Certified
Applicable to:Power BI visuals
NaN out of 5
By getting this product, I give Microsoft permission to use or share my account information so that the provider can contact me regarding this product and related products. I agree to the provider's 使用条款 and 隐私策略 and understand that the rights to use this product do not come from Microsoft, unless Microsoft is the provider. Use of 条款 is governed by separate 隐私 and {4}.