定价 可能需要额外购买
Control charts for Power BI. Analyze & track your processes and see whether they are in control.
Control charts enable you to see whether your process is in control. Control charts will also help you to predict the performance of your process.
Control charts form the cornerstone of the Statistical Process Control (SPC) and they are widely used in process improvement paradigms, such as Lean Six Sigma. Control charts clearly indicate whether the process that generated your data is in control and whether it has changed.
Craydec Control Charts implement control charts in the traditional way, making them compatible with the mostly used process analyzing and improvement software packages. The visual also contains features that are traditionally not found in control charts, such as interactive data point selection, tooltips and facets (small multiples).
Free vs. full version
Free version supports the Run Chart. With a license, you can unlock all the features of the charts.
Get a license from our store: https://craydec.onfastspring.com
Trial also available.
Features
* Charts
- Run Chart - visualize your data by time
- I-Chart - individual data points
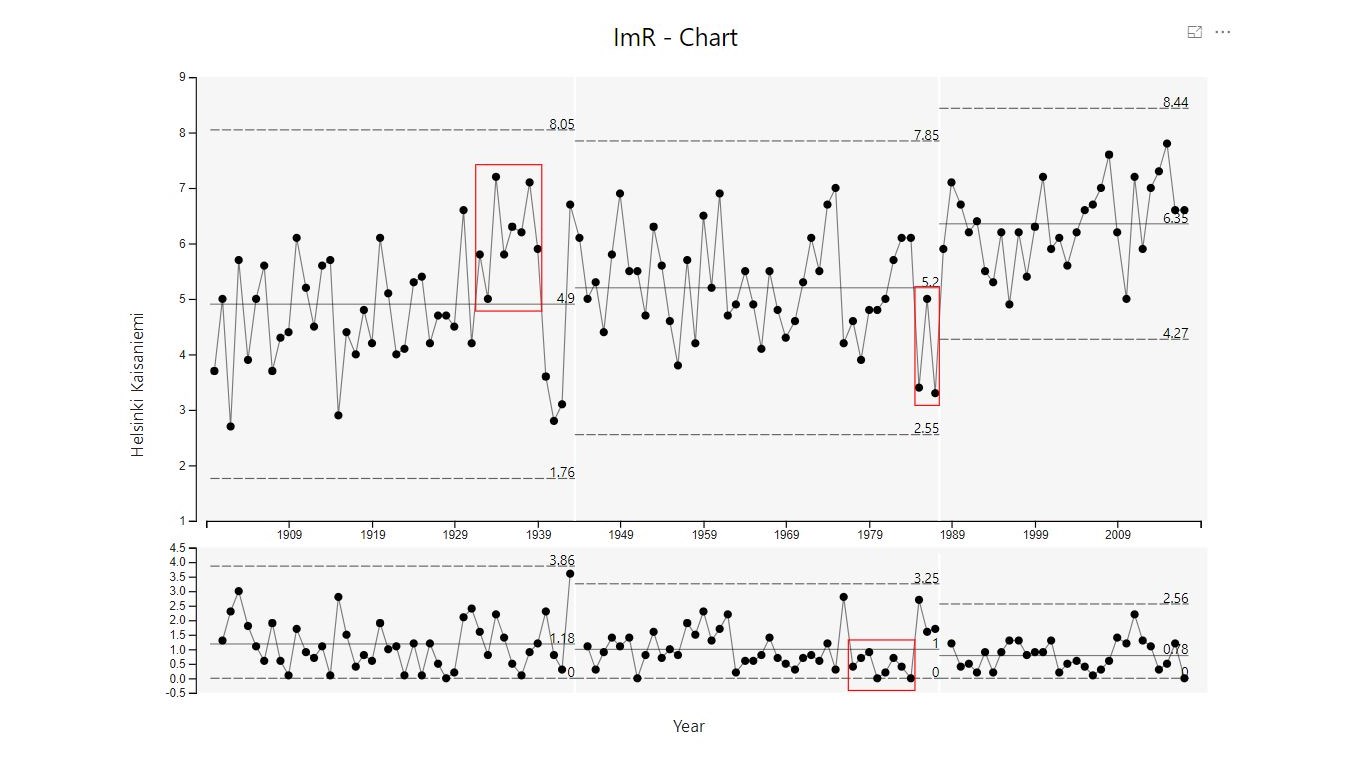
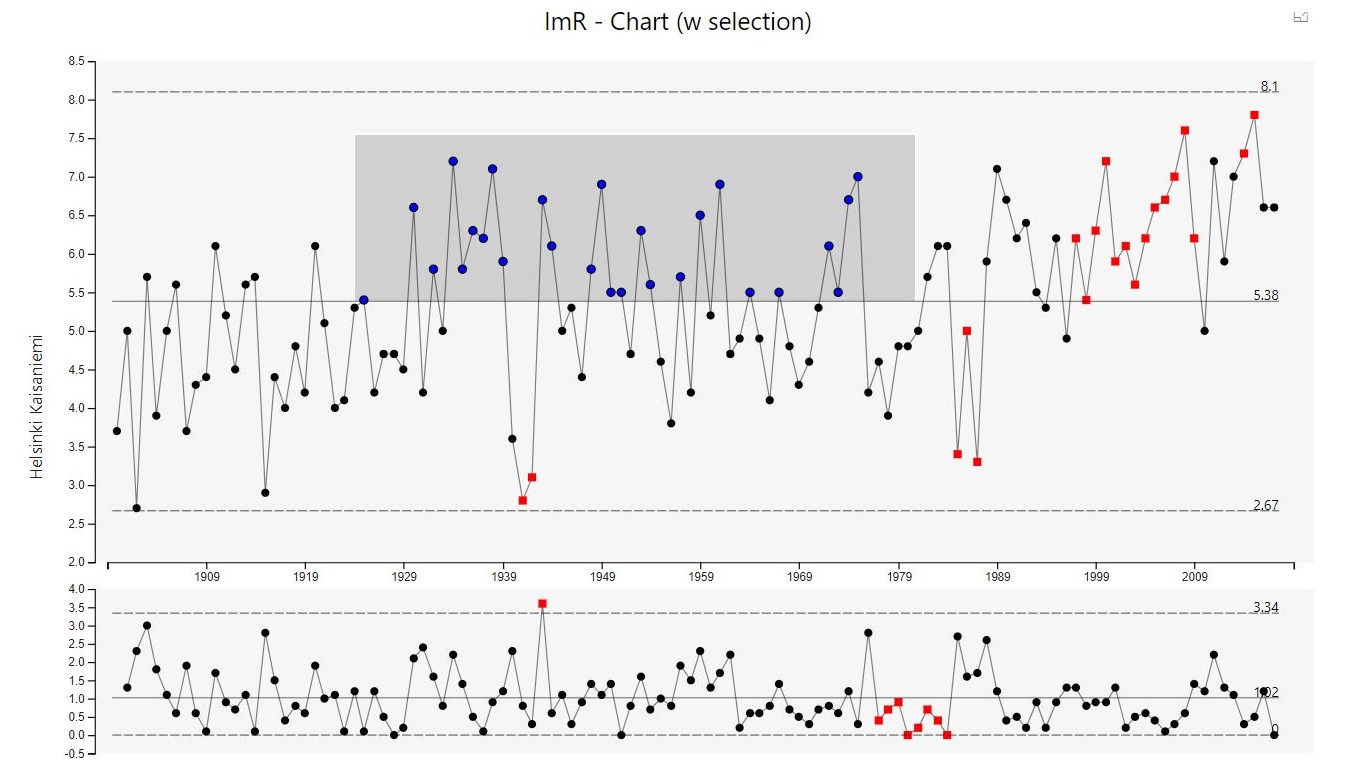
- ImR-Chart - individual data points with variation
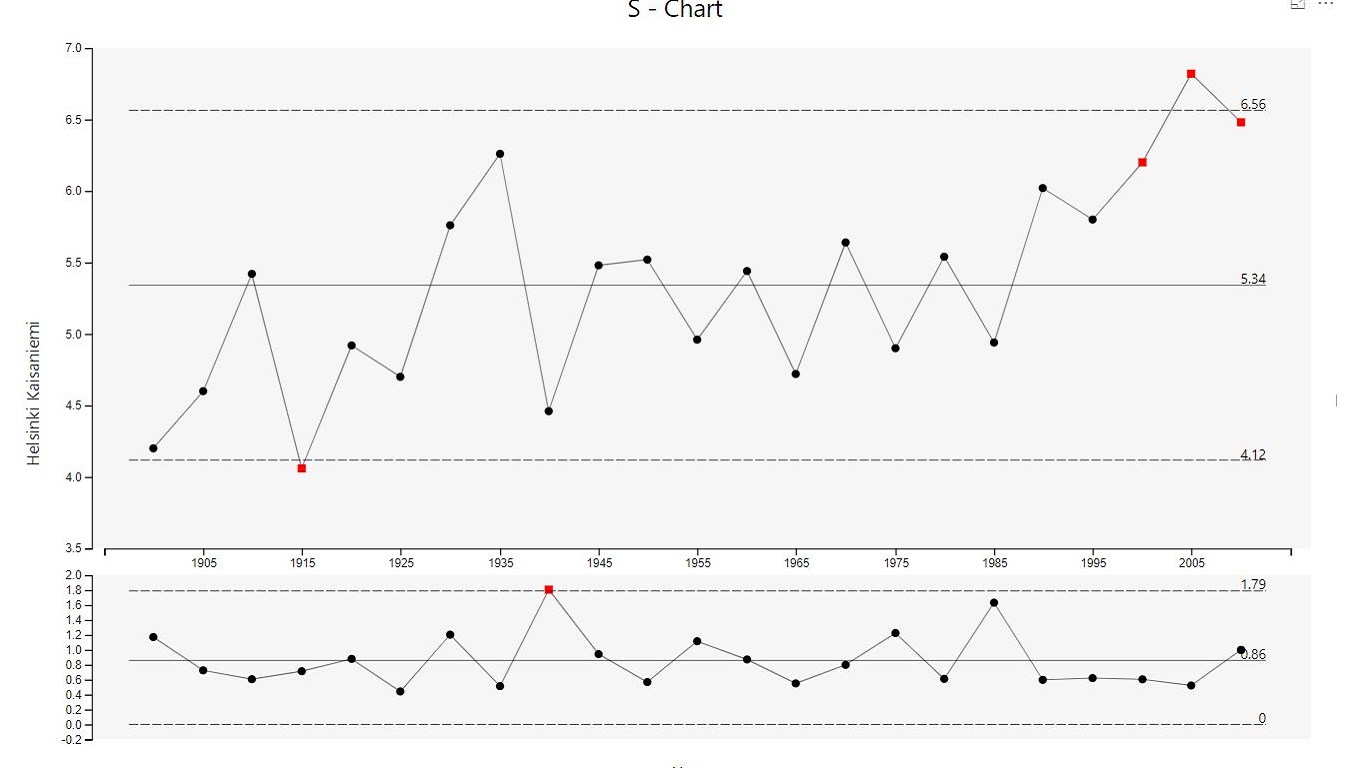
- S-Chart - Average + standard deviation, both are visualized
- R-Chart - Average + range, both are visualized
- np-Chart - For defectives, fixed group size.
- p-Chart - For defectives, variable group size.
- c-Chart - For defect counts, fixed group size.
- u-Chart - For defect counts, variable group size.
* Drill-down
Drill-down is now supported.
* Custom limits
Use custom values for control lines. Dynamic (from data) or static (from settings).
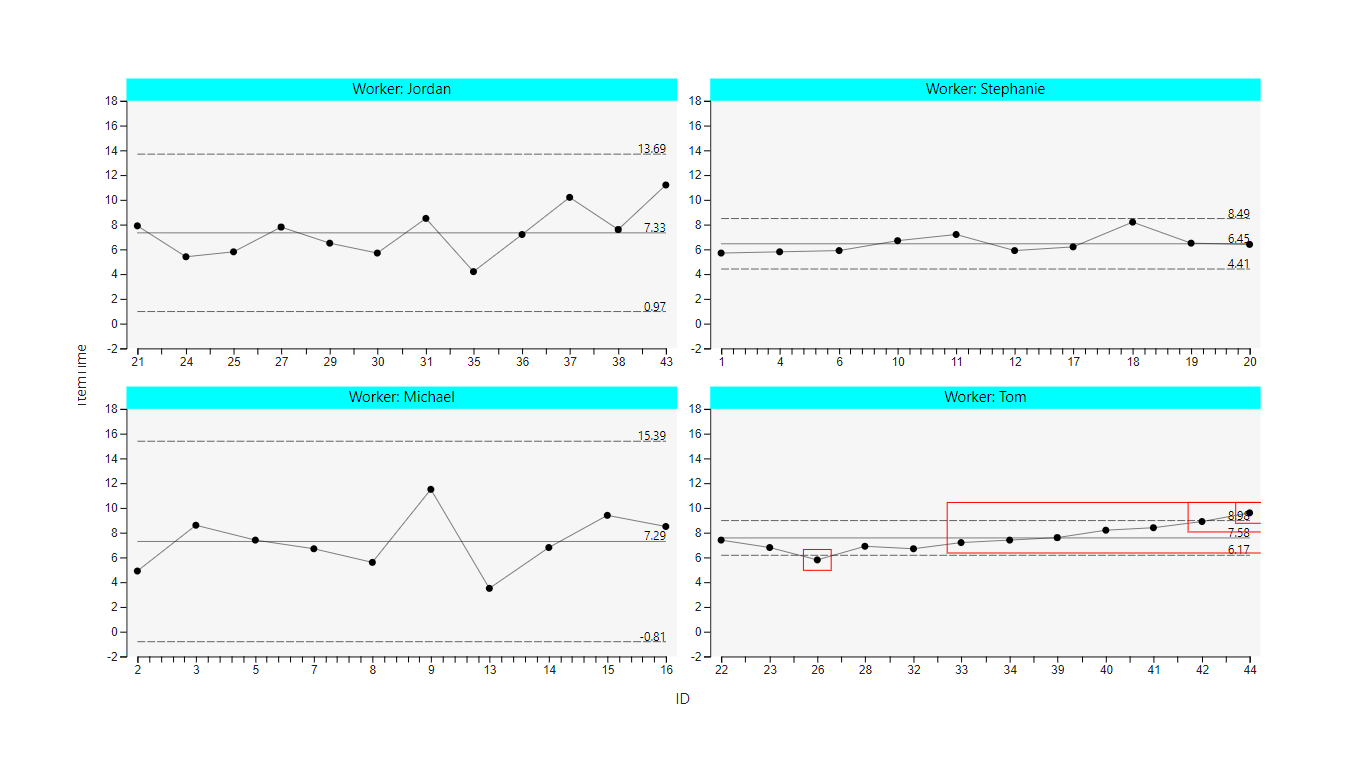
* Facets (Small multiples)
Use a datarole to create multiple chart items. For example, you can use the name of the worker to draw
a control chart for each worker. Small multiples make comparing different group really easy.
Each facet can contain it's own selection.
Facets are available also in the free version for the run chart.
* Customizable Run tests
With standard Nelson rules (https://en.wikipedia.org/wiki/Nelson_rules)
- Run test 1 - Single point over or under UCL / LCL - For data and variation
- Run test 2 - 9 (or n) consecutive points over or under average - For data and variation
- Run test 3 - 6 (or n) consecutive points increasing or decreasing
- Run test 5 - 2 out of 3 points over or under 2-sigma warning line
- Run test 6 - 4 out of 5 points over or under 1-sigma warning line
Color of the run chart visualization can be selected separately for both sides of the error (upper / lower). Run test tooltip can be customized.
* Data point selection
Select data points with brushing, ie. by drawing a box. With brushing, you can easily select all the datapoints above or under certain threshold, or select all points from a certain time period.
Available in Run/I/ImR/np/p/c/u-Charts.
* Stepping / Subgrouping
Add a datarole indicating a change point in process and you'll get custom limits calculated for each subgroup.
* User selectable control / sigma lines
- Control Line (CL)
- Upper Control Line (UCL) & Lower Control Line (LCL)
- 2-sigma warning line
- 1-sigma warning line
How do you want these lines to look? It's your call. You can customize color, width, and opacity as you want.
* Tooltips
Want to get detailed info on data point? Use tooltips. Multiple dataroles supported. Works also with measures.
--
Charts included in the visual: Run Chart, I-Chart (X-Chart), ImR-Chart, S-Chart (x-bar s), R-Chart (x-bar range),
np-Chart, p-Chart, c-Chart, and u-Chart.
Control charts are also called process behavior charts and Shewhart's charts.
视觉对象功能
使用此视觉对象时,它
- 可以访问外部服务或资源
概览

来自 Craydec Oy 的其他应用
Craydec TimelinesCraydec Oy Power BI visualsVisualize dates and times (or numbers) with gantt or rote style. Simple. Effective. Easy to use.
Applicable to:Power BI visuals
NaN out of 2
Craydec Regression ChartCraydec OyPower BI visualsScatter chart with linear regression for large datasets. Easy to use and fast. With small multiples.
Applicable to:Power BI visuals
NaN out of 2