定价 免费
Bars are plotted and sorted continuously as they progress through a range of periods.
Highlights
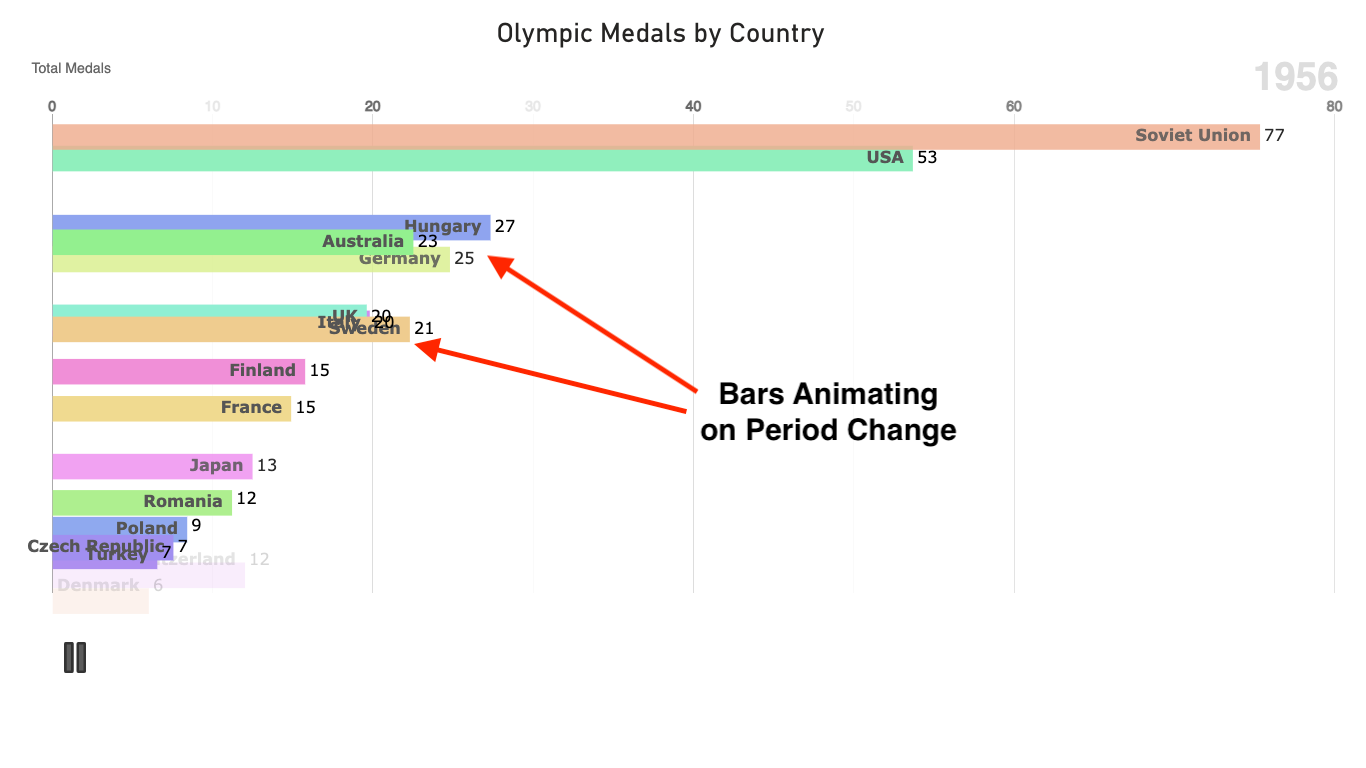
- The chart presents a typical bar chart but offers the capability of animating the bars through periods such as time. The bars resize and relocate for each period.
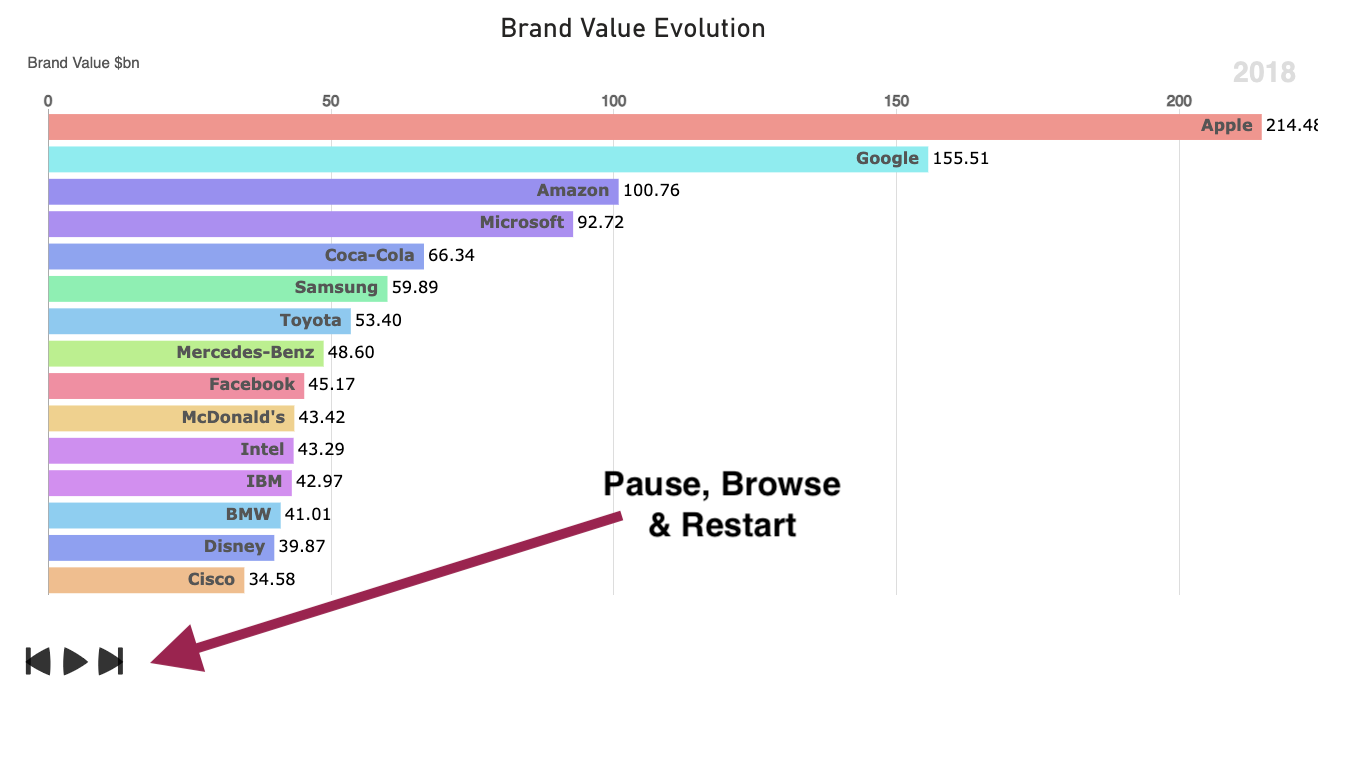
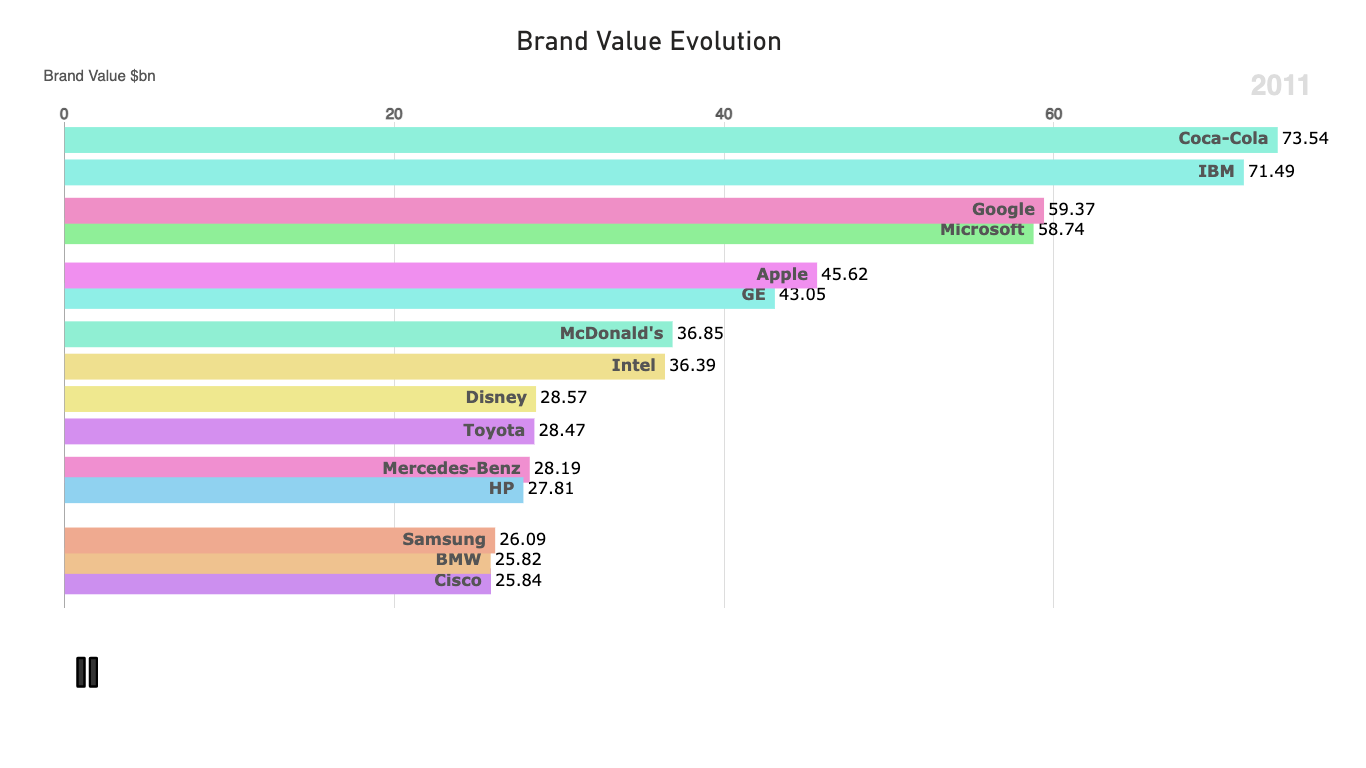
- A user can pause the animation at any point and can then restart the animation or browse to the next or previous period.
- Values are shown at the end of each bar.
- A variety of properties are available to the designer which include adjustment of point and period change durations, show/hide pause panel, font/color editing and the number of bar items to be shown.
This custom visualization was generated by the Inovista Animator. A custom image is loaded into the Animator where additional animations can be added, the resultant image is then exported as a Power BI visual. Find out more at: https://www.inovista.com
视觉对象功能
使用此视觉对象时,它
- 可以访问外部服务或资源
概览

来自 INOVISTA LIMITED 的其他应用
Animator for Power BIINOVISTA LIMITED Power BI visualsCreate custom, data-driven chart and infographic animations based on any SVG image.
Applicable to:Power BI visuals
NaN out of 2
Animated Image and Bubble ChartINOVISTA LIMITEDPower BI visualsAn animated bubble chart that can also use images. The animation can be paused and restarted.
Applicable to:Power BI visuals
NaN out of 2
By getting this product, I give Microsoft permission to use or share my account information so that the provider can contact me regarding this product and related products. I agree to the provider's 使用条款 and 隐私策略 and understand that the rights to use this product do not come from Microsoft, unless Microsoft is the provider. Use of 条款 is governed by separate 隐私 and {4}.