FiltersClear all
Apps results
Showing 763 results in apps.
Power BI visualsRemove Power BI visuals
Power PlatformRemove Power Platform

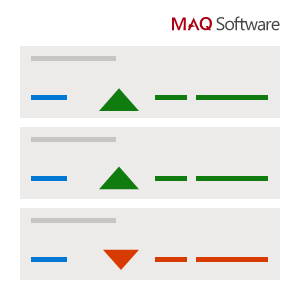
KPI Ticker by MAQ SoftwareMAQ LLC Power BI visualsStreamline your dashboard with rotating KPI visuals | Power BI Certified
Applicable to:Power BI visuals
1 out of 60
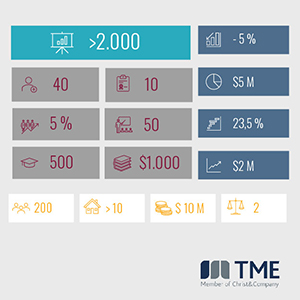
Multi Card KPIs by TME AGTME AGPower BI visualsA multiple cards Power BI visual to display and compare KPIs
Applicable to:Power BI visuals
2 out of 60

Dual Y-Axis Combo Chart (Standard)PBIVizEdit.comPower BI visualsShow relationship between data sets by combining columns, lines, scatter, area on dual Y-axes
Applicable to:Power BI visuals
3 out of 60

Aimplan Data Input TableAimplan ABPower BI visualsEnable users to edit and input table data from within Power BI
Applicable to:Power BI visuals
4 out of 60

Process GanttSCvation GmbHPower BI visualsVisualize operations, workflows, tasks, project timelines and more with millisecond accuracy
Applicable to:Power BI visuals
5 out of 60

Data MapdTypPower BI visualsData to map, made simple. Provide a new dimension to your data with high quality map visual
Applicable to:Power BI visuals
6 out of 60

Icon Pack by TME AGTME AGPower BI visualsIcon pack is a Power BI visual to search and display icons in your report
Applicable to:Power BI visuals
7 out of 60

Venn Diagram by MAQ SoftwareMAQ LLCPower BI visualsDisplay the relationship between two or more datasets | PBI certified
Applicable to:Power BI visuals
8 out of 60
PureViz Infographic - for PowerPoint to Power BIIntellectBIPower BI visualsTurn creative designs into animated and lightweight infographics. From Power Point to Power BI!
Applicable to:Power BI visuals
9 out of 60
Circular Gauge by MAQ SoftwareMAQ LLCPower BI visualsTrack your goals with precision | Power BI Certified
Applicable to:Power BI visuals
10 out of 60
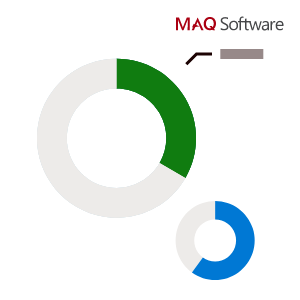
Ring Chart by MAQ SoftwareMAQ LLCPower BI visualsUnderstand the category breakdown of your data | PBI certified
Applicable to:Power BI visuals
11 out of 60

Pulse ChartMicrosoft CorporationPower BI visualsLine chart annotated with key events. Perfect for story telling with data
Applicable to:Power BI visuals
12 out of 60

ParaHTMLViewerParadigm BIPower BI visualsThis is a single Card HTML Viewer which can display Power BI Data, accept input and submit
Applicable to:Power BI visuals
13 out of 60

HTML VizCreator Cert by BI SamuraiBI SamuraiPower BI visualsMust-have certified HTML visual to create custom visualisations
Applicable to:Power BI visuals
14 out of 60

Apex Gantt Chart - Project TimelineAPEX Project Management Inc.Power BI visualsA professional Gantt Chart visual to improve project management and schedule reporting
Applicable to:Power BI visuals
15 out of 60
Tile Search Slicer by TME AGTME AGPower BI visualsProvides searching and slicing data with extensive customization
Applicable to:Power BI visuals
16 out of 60
Sunburst ChartVisioChartPower BI visualsShowcase hierarchical data with clarity—radial, readable, and ready for Power BI storytelling
Applicable to:Power BI visuals
17 out of 60
Calendar by DatanauDATANAU - CONSULTORIA INFORMÁTICA, UNIPESSOAL, LDAPower BI visualsCalendar by Datanau offers an exciting way to display and filter date related data.
Applicable to:Power BI visuals
18 out of 60

Waffle Chartkiewic.comPower BI visuals10x10 customizable grids of icons to visually represent and compare raw data values as a percentage.
Applicable to:Power BI visuals
19 out of 60

Box and Whisker (Standard)PBIVizEdit.comPower BI visualsA box and whisker chart shows data spread, highlighting the median, range, and outliers.
Applicable to:Power BI visuals
20 out of 60

Galigeo for PowerBIGALIGEOPower BI visualsGeomaps Made Simple: Galigeo's Location-Driven Insights for Power BI
Applicable to:Power BI visuals
21 out of 60
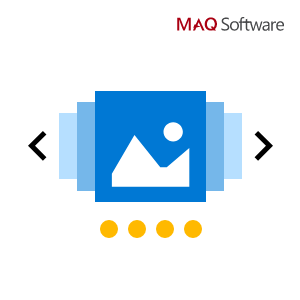
Image Carousel by MAQ SoftwareMAQ LLCPower BI visualsDynamically display images in Power BI
Applicable to:Power BI visuals
22 out of 60
TreeCK CorporationPower BI visualsTree structure with customisable URL as well as various formatting and customisation options
Applicable to:Power BI visuals
23 out of 60

Dynamic KPI Card by SerevisoEntech SPA AGPower BI visualsThe card shows a main KPI and allows to set up to two other references. Colour of border changes.
Applicable to:Power BI visuals
24 out of 60

Advanced Linear Gauge by MAQ SoftwareMAQ LLCPower BI visualsTrack and visualize progress for individual targets with precision | Power BI Certified
Applicable to:Power BI visuals
25 out of 60

Drill Down Line PRO (Filter) by ZoomChartsZoomChartsPower BI visualsCreate stunning line charts with powerful drill-down capabilities.
Applicable to:Power BI visuals
26 out of 60

Population Pyramid (Standard)PBIVizEdit.comPower BI visualsGraphically illustrate age and gender distribution of a given population
Applicable to:Power BI visuals
27 out of 60

Enlighten World Flag SlicerENLIGHTEN DESIGNSPower BI visualsCreate a visually compelling country slicer to filter your report.
Applicable to:Power BI visuals
28 out of 60

Acterys Table EditManagilityPower BI visualsEdit and manage data tables directly in Power BI with Acterys Table Edit.
Applicable to:Power BI visuals
29 out of 60

Pdf ViewerDS Analytics ABPower BI visualsThis visual utilizes PDF JS to display PDF documents from base64 encoded strings.
Applicable to:Power BI visuals
30 out of 60

Animated Bar Race ChartINOVISTA LIMITEDPower BI visualsBars are plotted and sorted continuously as they progress through a range of periods.
Applicable to:Power BI visuals
31 out of 60

Drill Down Donut PRO (Filter) by ZoomChartsZoomChartsPower BI visualsEnjoy interactive drilldowns, user friendly navigation and beautiful design.
Applicable to:Power BI visuals
32 out of 60

Ratings visual by TME AGTME AGPower BI visualsIt provides a variety of rating options for various performance indicators
Applicable to:Power BI visuals
33 out of 60
Hierarchical Filter / Slicer - xVizxViz LLC dba LumelPower BI visualsEnhance Insights: Hierarchy Filter with Display Values, Search, Navigation, Rule Formatting & More
Applicable to:Power BI visuals
34 out of 60

Enlighten Data StoryENLIGHTEN DESIGNSPower BI visualsUse beautifully designed text to tell your story.
Applicable to:Power BI visuals
35 out of 60

Mekko ChartMicrosoft CorporationPower BI visualsA mix of 100% stacked column chart and 100% stacked bar chart combined into one view
Applicable to:Power BI visuals
36 out of 60

PlotlyJS Visual by AkvelonAkvelonPower BI visualsPlotly.js visual by Akvelon combines Plotly.js, react-chart-editor and Power BI together.
Applicable to:Power BI visuals
37 out of 60

Tassels Parallel Sets SlicerWishyoulizationPower BI visualsAn interactive parallel sets based visual slicer for exploring multi-categorical data.
Applicable to:Power BI visuals
38 out of 60
Risk Matrix VizDATA LOOM PTY LTDPower BI visualsRisk Matrix Viz: Visualise Risk Likelihood and Impact in Power BI
Applicable to:Power BI visuals
39 out of 60
Custom SlicerOffice SolutionPower BI visualsCustom slicer for power bi visuals
Applicable to:Power BI visuals
40 out of 60

chat Power BI AIChartenzaPower BI visualsCreate an AI agent inside Power BI to chat with your data and get instant insights
Applicable to:Power BI visuals
41 out of 60
Ultimate Decomposition Treedataviz.boutique GmbHPower BI visualsThe Decomposition Tree can display hierarchical Information in combination with Images & Measures
Applicable to:Power BI visuals
42 out of 60

Histogram with points by MAQ SoftwareMAQ LLCPower BI visualsDisplays density of distribution using bars along with actual values represented by points
Applicable to:Power BI visuals
43 out of 60
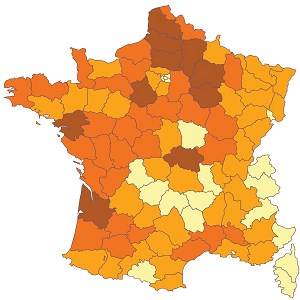
France Map DrilldownData KhiPower BI visualsVisual map of France with drilldown functionality to regions, departments, districts and cities
Applicable to:Power BI visuals
44 out of 60

PAFnow Process MiningCelonisPower BI visualsVisualize and analyze your business processes in an intelligent process flow based on event data
Applicable to:Power BI visuals
45 out of 60
Kanban Task BoardPowerGraphPower BI visualsThe PowerGraph Task Board enables a Agile/Kanban view of tasks, and connects to many sources.
Applicable to:Power BI visuals
46 out of 60

Datellers Bar of PieDATELLERS PRIVATE LIMITEDPower BI visualsAn Advanced Bar of Pie visual by Datellers
Applicable to:Power BI visuals
47 out of 60

Timeline BasicTheraTraqPower BI visuals Visualize your events in a timeline view.
Applicable to:Power BI visuals
48 out of 60
Risk Matrix / Heatmap - LeapLyticsLeapLytics GmbHPower BI visualsRisk Matrix: Our Solution for Professionals
Applicable to:Power BI visuals
49 out of 60

Enhanced ScatterMicrosoft CorporationPower BI visualsIncludes improvements to the existing scatter chart visual
Applicable to:Power BI visuals
50 out of 60

Calendar Pro by OKVIZOKVIZ Corp.Power BI visualsAn innovative way to visualize date-related data within Power BI reports.
Applicable to:Power BI visuals
51 out of 60

Rotating Tile by MAQ SoftwareMAQ LLCPower BI visualsMaximize report real estate | Power BI Certified
Applicable to:Power BI visuals
52 out of 60

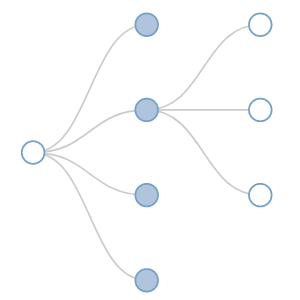
Journey Chart by MAQ SoftwareMAQ LLCPower BI visualsTransform dense statistical data into a network of categories and relationships.
Applicable to:Power BI visuals
53 out of 60
Horizontal Funnel by MAQ SoftwareMAQ LLCPower BI visualsRepresent the various stages and relevant metrics of a process | PBI certified
Applicable to:Power BI visuals
54 out of 60
Globe Data BarsJack ButtsPower BI visualsAn interactive and customizable 3D globe with data bars & tooltips
Applicable to:Power BI visuals
55 out of 60

Drill Down Timeline PRO (Filter) by ZoomChartsZoomChartsPower BI visualsExplore time-based data using columns or measures and multiple chart types: line, column, area.
Applicable to:Power BI visuals
56 out of 60

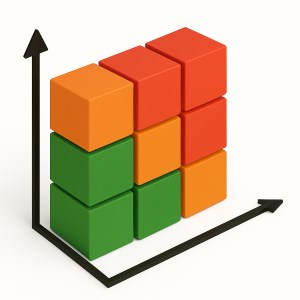
Stacked Clustered ChartDEFTEAM SOLUTIONS PRIVATE LIMITEDPower BI visualsStacked Clustered Chart visualizes quick trends using multiple categories with drill downs
Applicable to:Power BI visuals
57 out of 60

Advanced Line Chart (Standard)PBIVizEdit.comPower BI visualsVisualize up to 8 measures with different styles of line on dual y axes
Applicable to:Power BI visuals
58 out of 60
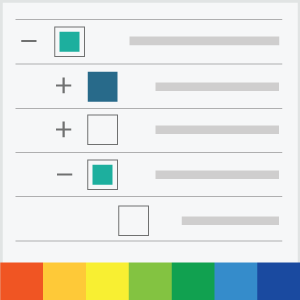
Hierarchical Bar ChartExcelnaccess.comPower BI visualsThis visual displays hierarchical data in the form of bar chart with +/- signs to view/hide details
Applicable to:Power BI visuals
59 out of 60
Thermometer by MAQ SoftwareMAQ LLCPower BI visualsRepresent progress toward goals | PBI certified
Applicable to:Power BI visuals
60 out of 60