FiltersClear all
Apps results
Showing 165 results in apps.
InfographicsRemove Infographics
Power BI visualsRemove Power BI visuals
Power PlatformRemove Power Platform
All results

Box and Whisker (Standard)PBIVizEdit.com Power BI visualsA box and whisker chart shows data spread, highlighting the median, range, and outliers.
Applicable to:Power BI visuals
1 out of 60


Image GallerypbiCraftPower BI visualsImage Gallery visual allows for an easy and straightforward way to upload and display your image
Applicable to:Power BI visuals
2 out of 60

ADWISE Advanced ColumnAdwise s.r.o.Power BI visualsCompare time periods, categories or quantities in advanced column chart with ease. Visual by ADWISE.
Applicable to:Power BI visuals
3 out of 60
Multi-pane CardMylocs IncPower BI visualsA collapsible multi-pane card visual
Applicable to:Power BI visuals
4 out of 60

Ultimate Venn DiagramSamuel GratzlPower BI visualsExplore Set Intersection using Venn or Euler Diagrams
Applicable to:Power BI visuals
5 out of 60

Risk Matrix by ProfitbaseProfitbase ASPower BI visualsFrom Insight to Action — Familiar Risk Visualization with Profitbase Risk Matrix
Applicable to:Power BI visuals
6 out of 60

Likert Scale Chart for Power BI by ChartExpochartexpo.comPower BI visualsVisualize your survey result instantly with an intuitive Likert Scale Chart
Applicable to:Power BI visuals
7 out of 60

Dynamic Radial Bar Chart by JTAJTA The Data ScientistsPower BI visualsInteractive drilldown radial bar chart with multiple configurations
Applicable to:Power BI visuals
8 out of 60

Walkers Animated PictogramWishyoulizationPower BI visualsAn animated pictographic bar chart for building visually appealing reports.
Applicable to:Power BI visuals
9 out of 60

swSankeyDiagram上北智信Power BI visuals桑基图即桑基能量分流图,也叫桑基能量平衡图。它是一种特定类型的流程图,图中延伸的分支的宽度对应数据流量的大小。
Applicable to:Power BI visuals

Apache ECharts VisualIlfat GalievPower BI visualsThe EChart Visual combines power of ECharts and Handlebars.js with Power BI data
Applicable to:Power BI visuals
11 out of 60

SMART KPI ListNova SilvaPower BI visualsIncrease the power of your KPI’s by adding context with the SMART KPI List
Applicable to:Power BI visuals
12 out of 60

Pie of Pie by JTAJTA The Data ScientistsPower BI visualsSlice to Spice: Transform your Pie Chart by Clicking! Dive deeper with a click, creating a new pie!
Applicable to:Power BI visuals
13 out of 60

BasicMap上北智信Power BI visuals中国地图组合组件,包括中国色块地图、热力地图、散点地图、流向地图
Applicable to:Power BI visuals

Text Enhancer by MAQ SoftwareMAQ LLCPower BI visualsCustomize the text in your Power BI reports | PBI certified
Applicable to:Power BI visuals
15 out of 60

Organization Chart北京上北智信科技有限公司Power BI visualsA standardized structure diagram generation control.
Applicable to:Power BI visuals
16 out of 60

ProgBarIT-DEV GmbHPower BI visualsProgBar: visual representation of percentage share
Applicable to:Power BI visuals
17 out of 60
egHeatmapegnite, Inc.Power BI visualsA heatmap table to see different values per row by color.
Applicable to:Power BI visuals
18 out of 60

swBoxPlot上北智信Power BI visuals1.箱线图组件能够明确的展示离群点的信息,同时能够让我们了解数据是否对称,数据如何分组、数据的峰度
Applicable to:Power BI visuals

Gantt by ProfitbaseProfitbase ASPower BI visualsDisplay projects and tasks on a time axis - perfect for project management
Applicable to:Power BI visuals
20 out of 60
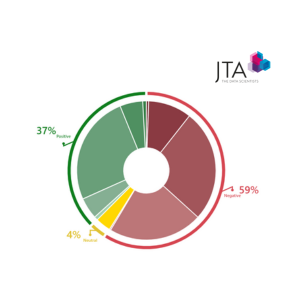
Donut Chart by JTAJTA The Data ScientistsPower BI visualsInstantly visualize a clear breakdown of positive, neutral, and negative feedback with Donut Chart!
Applicable to:Power BI visuals
21 out of 60
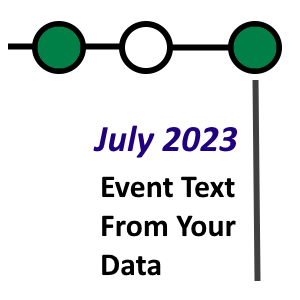
Time-lines (BI-Champ Suite)CodeX Enterprises LLCPower BI visualsCreate a time-line with dots representing events, keyed by dates.
Applicable to:Power BI visuals
22 out of 60

Counter CalendarIT-DEV GmbHPower BI visualsTrack your data changes in time!
Applicable to:Power BI visuals
23 out of 60

Symbol Chartpbi-consultantsPower BI visualsConnect your data to the real world, visualize it with symbols.
Applicable to:Power BI visuals
24 out of 60

Mapa Polski - Województwa, Powiaty, GminyEngagy P.S.A.Power BI visualsPolska w Twoich Rękach: aktualna Mapa Polski z podziałem na województwa powiaty i gminy!
Applicable to:Power BI visuals
25 out of 60
Chord DiagramVisioChartPower BI visualsChord Diagram visualizes complex data with customizable chords, colors, and interactive features
Applicable to:Power BI visuals
26 out of 60

SkylineAWPBIPower BI visualsVisually intuitive way of mapping activities into groups or dates.
Applicable to:Power BI visuals
27 out of 60

Markdown & Mermaid VisualIlfat GalievPower BI visualsMarkdown viewer and editor for Power BI with Mermaid Diagramming and charting tool
Applicable to:Power BI visuals
28 out of 60

Animator by SquillionSquillion Technology Private LimitedPower BI visualsElevate your reports with dynamic, engaging visuals that uncover insights and start conversations
Applicable to:Power BI visuals
29 out of 60

PackedBubbleChartQatar Financial Centre Regulatory AuthorityPower BI visualsPacked Bubble Chart
Applicable to:Power BI visuals
Overlapping Bar ChartAcorn HillPower BI visualsHorizontal bar chart allowing overlapping of bars and extensive customization.
Applicable to:Power BI visuals
31 out of 60

Dumbbell Bar ChartNova SilvaPower BI visualsUnleash the power of comparison with the Dumbbell Bar Chart
Applicable to:Power BI visuals
32 out of 60

Icons by QueryonQueryonPower BI visualsAccess hundreds of open-source icons to elevate your user experience.
Applicable to:Power BI visuals
33 out of 60

Animator for Power BIINOVISTA LIMITEDPower BI visualsCreate custom, data-driven chart and infographic animations based on any SVG image.
Applicable to:Power BI visuals
34 out of 60
Non-Ribbon Chord DiagramVisioChartPower BI visualsEnhance data analysis with Non Ribbon Chord Diagram in Microsoft Power BI by VisioChart
Applicable to:Power BI visuals
35 out of 60

ComicgenGramenerPower BI visualsComicgen adds comic characters whose emotion, pose, angle, etc can be controlled by data.
Applicable to:Power BI visuals
36 out of 60

accoPLANNING - Writeback, Planning, MatrixAccobat ASPower BI visualsVisual with writeback directly in Power BI for planning, master data (MDM), budgeting, forecasting
Applicable to:Power BI visuals
37 out of 60

process.science Process Miningprocess.science GmbH & Co. KGPower BI visualsExperience Process Mining in Power BI with process.science. Visualize, understand, optimize.
Applicable to:Power BI visuals
38 out of 60
Event Horizon Timeline ChartSoftcial Power BIPower BI visualsPower BI visual for tracking and analyzing milestones in a timeline fashion
Applicable to:Power BI visuals
39 out of 60

Bar RaceMeliorist Technology, Inc.Power BI visualsBring your data to life with an implementation of the animated Bar Race chart for Power BI
Applicable to:Power BI visuals
40 out of 60

Clustered Column Chart By AkvelonAkvelonPower BI visualsClustered Column Chart By Akvelon is enhanced by rectangle selection of columns
Applicable to:Power BI visuals
41 out of 60

KPI Performance CardSamed UluçayPower BI visualsTrack real-time performance in Power BI with KPI Performance Card! 🚀
Applicable to:Power BI visuals
42 out of 60

Markdown Viewer - LeapLyticsLeapLytics GmbHPower BI visualsIntroducing the Markdown-to-HTML Visual for Power BI: Unleash the Power of Text Formatting!
Applicable to:Power BI visuals
43 out of 60

Animated Image and Bubble ChartINOVISTA LIMITEDPower BI visualsAn animated bubble chart that can also use images. The animation can be paused and restarted.
Applicable to:Power BI visuals
44 out of 60

Process FlowSCvation GmbHPower BI visualsVisualize your business processes, including automatic variant computation and key metrics
Applicable to:Power BI visuals
45 out of 60
Traqplan Timeline ProTraqplanPower BI visualsCreates a plan on a page or gantt timeline for multiple projects with edge-wrap and change tracking.
Applicable to:Power BI visuals
46 out of 60

Lollipop Bar ChartNova SilvaPower BI visualsDeclutter your comparisons with a Lollipop chart
Applicable to:Power BI visuals
47 out of 60

Scatter Chart by AkvelonAkvelonPower BI visualsVisualize your data with Scatter Chart with rectangle selection support
Applicable to:Power BI visuals
48 out of 60
Waffle Chart MakerVisioChartPower BI visualsWaffle Chart for Power BI by VisioChart enhances data visualization, sorting, color customization
Applicable to:Power BI visuals
49 out of 60
Comparison ChartmogularPower BI visualsCompare connected information with a reference e.g. individual stocks vs market index
Applicable to:Power BI visuals
50 out of 60

sw3D_StackedBarDiagram上北智信Power BI visuals3D堆叠图,可渲染多层数据
Applicable to:Power BI visuals

Smart Grid-MapThe Green Bridge GmbHPower BI visualsPrecise Geospatial Mapping and Data Visualization for Power BI
Applicable to:Power BI visuals
52 out of 60

Stacked Column Chart by AkvelonAkvelonPower BI visualsStacked Column Chart by Akvelon is enhanced by rectangle selection of bars
Applicable to:Power BI visuals
53 out of 60

WorkstreamEngagy P.S.A.Power BI visualsWorkstream: Hierarchical Visualization for Microsoft Power BI
Applicable to:Power BI visuals
54 out of 60

KPI Chart by AkvelonAkvelonPower BI visualsShow your KPI lines with dynamic ranges to assess your progress
Applicable to:Power BI visuals
55 out of 60

ArcGIS PowerBI UsersEsri, Inc.Power BI visualsCustom data visualization to bring mapping capabilities to your reports and dashboards.
Applicable to:Power BI visuals
56 out of 60

Punchcard (Tabular Bubble Chart) by SquillionSquillion Technology Private LimitedPower BI visualsPunchCard for Data Analysis: Multi-Category Support, Dynamic Bubble Charts, Pie/Donut Transformation
Applicable to:Power BI visuals
57 out of 60

Ultimate UpSet PlotSamuel GratzlPower BI visualsExplore set overlaps of more than three sets interactively
Applicable to:Power BI visuals
58 out of 60

Lipstick Column ChartNova SilvaPower BI visualsCompact and precise visual comparison of two measures with a Lipstick Column Chart
Applicable to:Power BI visuals
59 out of 60
Apex Milestone TrendAPEX Project Management Inc.Power BI visualsA professional chart for monitoring and tracking milestone dates
Applicable to:Power BI visuals
60 out of 60