FiltersClear all
Apps results
Showing 749 results in apps.
Power BI visualsRemove Power BI visuals
Power PlatformRemove Power Platform

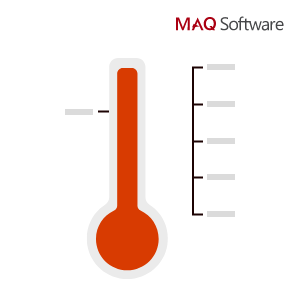
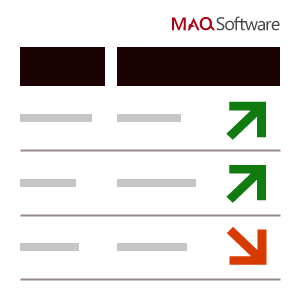
Thermometer by MAQ SoftwareMAQ LLC Power BI visualsRepresent progress toward goals | PBI certified
Applicable to:Power BI visuals
1 out of 60
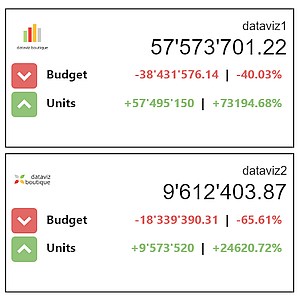
Ultimate KPI Card API Licensedataviz.boutique GmbHPower BI visualsShows a value, its variance to a reference value and its var. to 2nd or 3rd ref. value. Show Trend!
Applicable to:Power BI visuals
2 out of 60
Kanban Task BoardPowerGraphPower BI visualsThe PowerGraph Task Board enables a Agile/Kanban view of tasks, and connects to many sources.
Applicable to:Power BI visuals
3 out of 60

Candlestick by OKVIZOKVIZ Corp.Power BI visualsPresents stock data using a specialized chart made up of several candles.
Applicable to:Power BI visuals
4 out of 60

Enhanced ScatterMicrosoft CorporationPower BI visualsIncludes improvements to the existing scatter chart visual
Applicable to:Power BI visuals
5 out of 60

Drill Down Donut PRO (Pin) by ZoomChartsZoomChartsPower BI visualsEnjoy interactive drilldowns, user friendly navigation and beautiful design.
Applicable to:Power BI visuals
6 out of 60

Count Down TimerMicrosoft CorporationPower BI visualsBasic timer that continuously counts down to a specified date and time
Applicable to:Power BI visuals
7 out of 60

Animated Treemap by iFouriFour Technolab Pvt. Ltd.Power BI visualsDynamic visualization that displays hierarchical data using nested rectangles
Applicable to:Power BI visuals
8 out of 60

Quadrant Chart by MAQ SoftwareMAQ LLCPower BI visualsRepresent data in separate quadrants to show distribution and items that share common traits.
Applicable to:Power BI visuals
9 out of 60

Grid by MAQ SoftwareMAQ LLCPower BI visualsNavigate large data sets with ease by showcasing data in a paginated, sortable grid | PBI certified
Applicable to:Power BI visuals
10 out of 60

ImageplainbiPower BI visualsDisplay images of your data just with one click - image URLs or base64 encoded
Applicable to:Power BI visuals
11 out of 60

KPI IndicatorFredrik HedenströmPower BI visualsVisualization of key performance indicators. Includes visualization of status, trend and deviation.
Applicable to:Power BI visuals
12 out of 60

Treemap Bar Chart by MAQ SoftwareMAQ LLCPower BI visualsCategorize hierarchical data with color-coded, proportional rectangles
Applicable to:Power BI visuals
13 out of 60

Drill Down Graph PRO (Filter) by ZoomChartsZoomChartsPower BI visualsBuild networks and explore relations within them with the first true graph visual for Power BI.
Applicable to:Power BI visuals
14 out of 60
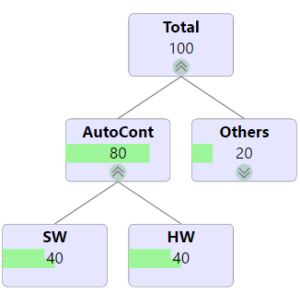
TreeVizAutoCont CZ a.s.Power BI visualsTree structure data visualization
Applicable to:Power BI visuals
15 out of 60
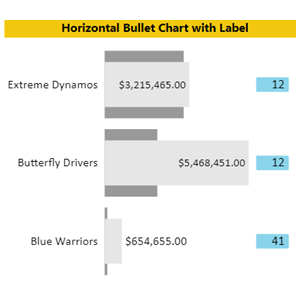
Horizontal Bullet Chart with LabelBusiness Applications :: BACPower BI visualsThe bullet chart displays multiple measures in a single visual
Applicable to:Power BI visuals
16 out of 60

Social Network GraphArthur Graus Training & ConsultancyPower BI visualsVisualize social networks like facebook, linkedin or organization graphs.
Applicable to:Power BI visuals
17 out of 60

PictureThisApps for Power BI Power BI visualsA picture is worth a thousand words, why not use more images in your report?
Applicable to:Power BI visuals
18 out of 60

PDF Uploader/ViewerpbiCraftPower BI visualsUpload and securely share any PDF file with your colleagues
Applicable to:Power BI visuals
19 out of 60

Power BI Visual EditorIlfat GalievPower BI visualsThe Visual allows you to edit schemas of Deneb, PlotlyJS, and other visuals
Applicable to:Power BI visuals
20 out of 60
Forecast Using Multiple Models by MAQ SoftwareMAQ LLCPower BI visualsTest time series models to forecast future values based on historical data.
Applicable to:Power BI visuals
21 out of 60

Risk Matrix / Heatmap - LeapLyticsLeapLytics GmbHPower BI visualsRisk Matrix: Our Solution for Professionals
Applicable to:Power BI visuals
22 out of 60

Drill Down Map PRO (Filter) by ZoomChartsZoomChartsPower BI visualsExplore location data with powerful on-chart filtering capabilities.
Applicable to:Power BI visuals
23 out of 60

Summary TableFredrik HedenströmPower BI visualsRenders a table with summary rows and make it possible to apply custom styles to any row and column.
Applicable to:Power BI visuals
24 out of 60

Stacked Clustered ChartDEFTEAM SOLUTIONS PRIVATE LIMITEDPower BI visualsStacked Clustered Chart visualizes quick trends using multiple categories with drill downs
Applicable to:Power BI visuals
25 out of 60

Horizontal Funnel by MAQ SoftwareMAQ LLCPower BI visualsRepresent the various stages and relevant metrics of a process | PBI certified
Applicable to:Power BI visuals
26 out of 60

Radial chart by Devlup FunnelsDevlup FunnelsPower BI visualsRadial bar charts provide a visually engaging depiction of categorical data through their circular l
Applicable to:Power BI visuals
27 out of 60

Donut Chart imageData SL ConsultingPower BI visualsAdvanced Donut Chart Visualization
Applicable to:Power BI visuals
28 out of 60

Untap Text BoxUntapPower BI visualsInput and justify text in reports with Untap Text Box for enhanced, aesthetically pleasing data narr
Applicable to:Power BI visuals
29 out of 60

Vertical Bullet Chart (Standard)PBIVizEdit.comPower BI visualsShow progress of measure towards a goal and/or its performance against a reference
Applicable to:Power BI visuals
30 out of 60

Power Slider by TME AGTME AGPower BI visualsA powerful slider to select a discrete range of numeric or date category values
Applicable to:Power BI visuals
31 out of 60

Inforiver EDITablexViz LLC dba LumelPower BI visualsReference data / Master data / Meta data table editor with approval workflow, audit & governance
Applicable to:Power BI visuals
32 out of 60

ADWISE Advanced ColumnAdwise s.r.o.Power BI visualsCompare time periods, categories or quantities in advanced column chart with ease. Visual by ADWISE.
Applicable to:Power BI visuals
33 out of 60
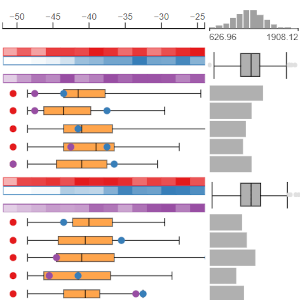
时勤Echart-Boxplot_Light_Velocity上海时勤信息科技有限公司Power BI visualsBox plot is a very practical data visualization tool that can quickly provide an overview of data.
Applicable to:Power BI visuals
34 out of 60
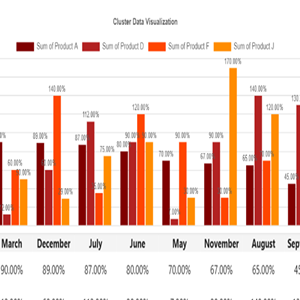
Cluster For PowerBICybercoderzPower BI visualsThis Cluster Chart is a Power BI visual that provides a flexible and interactive way to visualize.
Applicable to:Power BI visuals
35 out of 60

Traffic Light - LeapLyticsLeapLytics GmbHPower BI visualsTraffic Light Visual: Our Solution for Professionals
Applicable to:Power BI visuals
36 out of 60
Violin Plot by MAQ SoftwareMAQ LLCPower BI visualsVisualize data distribution across categories
Applicable to:Power BI visuals
37 out of 60

Fish Bone Chart for Power BIOffice SolutionPower BI visualsA Fishbone chart identifies causes of a problem, categorized into branches, for root cause analysis.
Applicable to:Power BI visuals
38 out of 60

Dual KPIMicrosoft CorporationPower BI visualsEfficiently visualizes two measures over time, showing their trend on a joint timeline
Applicable to:Power BI visuals
39 out of 60

Text Wrapper by MAQ SoftwareMAQ LLCPower BI visualsRepresent complete data by enabling text wrapping on Power BI reports | PBI certified
Applicable to:Power BI visuals
40 out of 60

Decomposition Tree by JTAJTA The Data ScientistsPower BI visualsCustomizable bars, text, percentages, icons in the Horizontal Decomposition Tree.
Applicable to:Power BI visuals
41 out of 60
Event Table ViewerPro2Future GmbHPower BI visualsComparison of event sequence, categorical, and numerical data in an interactive tabular layout.
Applicable to:Power BI visuals
42 out of 60

Nous MatrixNousPower BI visualsAdvanced Matrix visual for Power BI with customizable layouts, dynamic formatting, and clarity.
Applicable to:Power BI visuals
43 out of 60
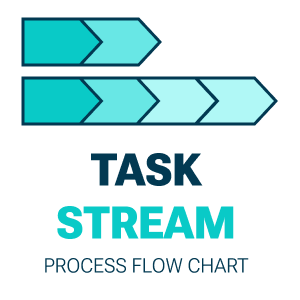
Task Stream Process Flow ChartSoftcial VisualsPower BI visualsPower BI custom visual for tracking task flows, milestones, and dependencies with customizable views
Applicable to:Power BI visuals
44 out of 60

LineDot ChartMicrosoft CorporationPower BI visualsAnimated line chart with fun animated dots. Useful for engaging an audience with data
Applicable to:Power BI visuals
45 out of 60

Dot Plot by MAQ SoftwareMAQ LLCPower BI visualsHighlight gaps, clusters, and outliers in your data | PBI certified
Applicable to:Power BI visuals
46 out of 60
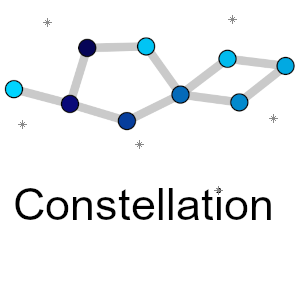
constellationGrognard Digital SolutionsPower BI visualsVisualize complex networks of interconnected data using a force-directed graph
Applicable to:Power BI visuals
47 out of 60

Stream GraphMicrosoft CorporationPower BI visualsA stacked area chart with smooth interpolation. Often used to display values over time
Applicable to:Power BI visuals
48 out of 60
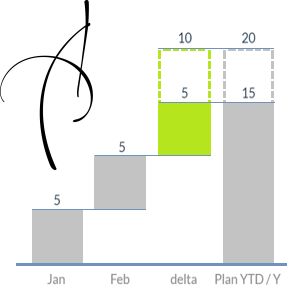
Waterfall-Visual-ExtendedAuxil Management GmbHPower BI visualsWaterfall for simple visualisation of deviations between bars and final values
Applicable to:Power BI visuals
49 out of 60

Bubble Chart by AkvelonAkvelonPower BI visualsVisualize your quantitative data easily with Bubble Chart by Akvelon
Applicable to:Power BI visuals
50 out of 60
KPI Grid by MAQ SoftwareMAQ LLCPower BI visualsSeparate hierarchical data into categories to illustrate trends | PBI certified
Applicable to:Power BI visuals
51 out of 60
Multi-pane CardMylocs IncPower BI visualsA collapsible multi-pane card visual
Applicable to:Power BI visuals
52 out of 60

react-leaflet--routing-mapGoldberg Corporate FinancePower BI visualsA Routing Map using the latest version of React , Leaflet, and the Power BI Visuals API 5.11.0
Applicable to:Power BI visuals
53 out of 60
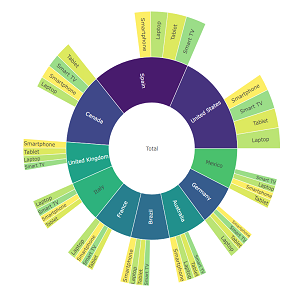
flashbi fantailFlashBIPower BI visualsFanTail - Interactive sunburst reflecting data hierarchies, relationships and relative values.
Applicable to:Power BI visuals
54 out of 60
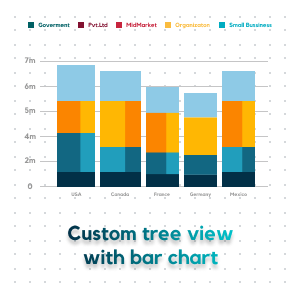
Custom tree view with bar chartOffice SolutionPower BI visualsChart with the combination of Bar and Tree map in which width and height of column can be managed
Applicable to:Power BI visuals
55 out of 60
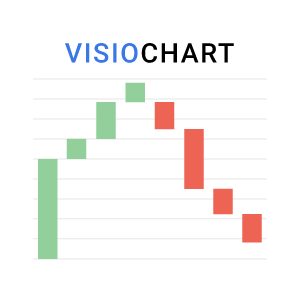
Waterfall ChartVisioChartPower BI visualsWaterfall chart can be used to see monthly income, expenses, revenues, and current account balances
Applicable to:Power BI visuals
56 out of 60

AdaptiveCardsParadigm BIPower BI visualsAdaptive Cards for Power BI
Applicable to:Power BI visuals
57 out of 60

Walkers Animated PictogramWishyoulizationPower BI visualsAn animated pictographic bar chart for building visually appealing reports.
Applicable to:Power BI visuals
58 out of 60

AI LensAI LensPower BI visualsChatGPT, OpenAI and AI directly in Power BI with a chat interface
Applicable to:Power BI visuals
59 out of 60

Likert Scale Chart for Power BI by ChartExpochartexpo.comPower BI visualsVisualize your survey result instantly with an intuitive Likert Scale Chart
Applicable to:Power BI visuals
60 out of 60