FiltersClear all
Apps results
Showing 775 results in apps.
Power BI visualsRemove Power BI visuals
Power PlatformRemove Power Platform


Image GallerypbiCraft Power BI visualsImage Gallery visual allows for an easy and straightforward way to upload and display your image
Applicable to:Power BI visuals
1 out of 60

Stream GraphMicrosoft CorporationPower BI visualsA stacked area chart with smooth interpolation. Often used to display values over time
Applicable to:Power BI visuals
2 out of 60

HTML VizCreator Flex by BI SamuraiBI SamuraiPower BI visualsThis visual can be used for nearly anything.
Applicable to:Power BI visuals
3 out of 60

Text Wrapper by MAQ SoftwareMAQ LLCPower BI visualsRepresent complete data by enabling text wrapping on Power BI reports | PBI certified
Applicable to:Power BI visuals
4 out of 60

Bubble Chart by AkvelonAkvelonPower BI visualsVisualize your quantitative data easily with Bubble Chart by Akvelon
Applicable to:Power BI visuals
5 out of 60
Forecast Using Multiple Models by MAQ SoftwareMAQ LLCPower BI visualsTest time series models to forecast future values based on historical data.
Applicable to:Power BI visuals
6 out of 60

Grid by MAQ SoftwareMAQ LLCPower BI visualsNavigate large data sets with ease by showcasing data in a paginated, sortable grid | PBI certified
Applicable to:Power BI visuals
7 out of 60

PDF Uploader/ViewerpbiCraftPower BI visualsUpload and securely share any PDF file with your colleagues
Applicable to:Power BI visuals
8 out of 60

Drill Down Map PRO (Filter) by ZoomChartsZoomChartsPower BI visualsExplore location data with powerful on-chart filtering capabilities.
Applicable to:Power BI visuals
9 out of 60

Social Network GraphArthur Graus Training & ConsultancyPower BI visualsVisualize social networks like facebook, linkedin or organization graphs.
Applicable to:Power BI visuals
10 out of 60
constellationGrognard Digital SolutionsPower BI visualsVisualize complex networks of interconnected data using a force-directed graph
Applicable to:Power BI visuals
11 out of 60

BasicMap上北智信Power BI visuals中国地图组合组件,包括中国色块地图、热力地图、散点地图、流向地图
Applicable to:Power BI visuals

Untap Text BoxUntapPower BI visualsInput and justify text in reports with Untap Text Box for enhanced, aesthetically pleasing data narr
Applicable to:Power BI visuals
13 out of 60

Summary TableFredrik HedenströmPower BI visualsRenders a table with summary rows and make it possible to apply custom styles to any row and column.
Applicable to:Power BI visuals
14 out of 60

Inside-Out Org Chart for HR AnalyticsOffice SolutionPower BI visualsThe Inside-Out Org Chart is a radial visualization that provides a holistic view of an organization.
Applicable to:Power BI visuals
15 out of 60

Vertical Bullet Chart (Standard)PBIVizEdit.comPower BI visualsShow progress of measure towards a goal and/or its performance against a reference
Applicable to:Power BI visuals
16 out of 60

AdaptiveCardsParadigm BIPower BI visualsAdaptive Cards for Power BI
Applicable to:Power BI visuals
17 out of 60
KPI Grid by MAQ SoftwareMAQ LLCPower BI visualsSeparate hierarchical data into categories to illustrate trends | PBI certified
Applicable to:Power BI visuals
18 out of 60

Power ON Visual Planner Service (Organizational Store)Power ONPower BI visualsEnables planning, data collection and write-back to various data sources from Power BI
Applicable to:Power BI visuals
19 out of 60

Easy SPCBCN Group Ltd.Power BI visualsRevolutionise your decision making with EasySPC.
Applicable to:Power BI visuals
20 out of 60

Drill Down Graph PRO (Filter) by ZoomChartsZoomChartsPower BI visualsBuild networks and explore relations within them with the first true graph visual for Power BI.
Applicable to:Power BI visuals
21 out of 60

Floor Plan Visual by Simpson AssociatesSIMPSON ASSOCIATES INFORMATION SERVICES LIMITEDPower BI visualsVisualise your data against your real-world floor plans
Applicable to:Power BI visuals
22 out of 60

Polar Chart (Standard)PBIVizEdit.comPower BI visualsCompare different categories like different products based on multiple variables
Applicable to:Power BI visuals
23 out of 60
Custom tree view with bar chartOffice SolutionPower BI visualsChart with the combination of Bar and Tree map in which width and height of column can be managed
Applicable to:Power BI visuals
24 out of 60

Zebra BI Tables 5.4.1 (deprecated)Zebra BIPower BI visualsThe Zebra BI Tables 5.4.1 (deprecated) is still supported but it is no longer developed.
Applicable to:Power BI visuals
25 out of 60
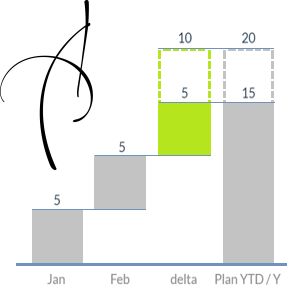
Waterfall-Visual-ExtendedAuxil Management GmbHPower BI visualsWaterfall for simple visualisation of deviations between bars and final values
Applicable to:Power BI visuals
26 out of 60
Waterfall ChartVisioChartPower BI visualsWaterfall chart can be used to see monthly income, expenses, revenues, and current account balances
Applicable to:Power BI visuals
27 out of 60

Likert Scale Chart for Power BI by ChartExpopolyvista.comPower BI visualsVisualize your survey result instantly with an intuitive Likert Scale Chart
Applicable to:Power BI visuals
28 out of 60

Gantt by ProfitbaseProfitbase ASPower BI visualsDisplay projects and tasks on a time axis - perfect for project management
Applicable to:Power BI visuals
29 out of 60
Violin Plot by MAQ SoftwareMAQ LLCPower BI visualsVisualize data distribution across categories
Applicable to:Power BI visuals
30 out of 60

Inforiver Writeback Matrix for Planning, Budgeting & ForecastingxViz LLC dba LumelPower BI visualsEnterprise-grade writeback matrix for building connected & secure planning (xP&A / FP&A / EPM) apps
Applicable to:Power BI visuals
31 out of 60
Aster Plot ChartVisioChartPower BI visualsA customizable Aster Plot chart for Power BI to visualize proportions with angular and radial values
Applicable to:Power BI visuals
32 out of 60

Radial chart by Devlup FunnelsDevlup FunnelsPower BI visualsRadial bar charts provide a visually engaging depiction of categorical data through their circular l
Applicable to:Power BI visuals
33 out of 60
swOrgChart_2.1sharewinfohkPower BI visualscan be applied to business scenarios such as company organizational structure and family genealogy
Applicable to:Power BI visuals

Table edit - Dynamics 365 Finance business performance planningMicrosoft Dynamics 365Power BI visualsSimplify data management with Table edit visual.
Applicable to:Power BI visuals
35 out of 60
Marimekko Chart - xVizxViz LLC dba LumelPower BI visualsVisualize data over a pair of categories & KPIs on actual/100% scale with advanced analytics!
Applicable to:Power BI visuals
36 out of 60
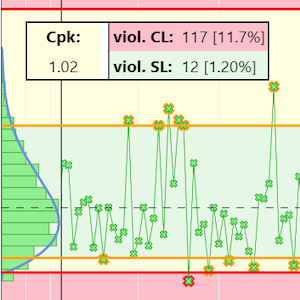
SPC VisualNextGenIndustriesPower BI visualsSPC - Statistical process control, Cp(k)/Pp(k) acc. ISO 22514, supporting online/realtime operation.
Applicable to:Power BI visuals
37 out of 60

SMART KPI ListNova SilvaPower BI visualsIncrease the power of your KPI’s by adding context with the SMART KPI List
Applicable to:Power BI visuals
38 out of 60

Ultimate Venn DiagramSamuel GratzlPower BI visualsExplore Set Intersection using Venn or Euler Diagrams
Applicable to:Power BI visuals
39 out of 60

AI LensAI LensPower BI visualsChatGPT, OpenAI and AI directly in Power BI with a chat interface
Applicable to:Power BI visuals
40 out of 60
SPC ChartNorth East Ambulance Service FTPower BI visualsAnalyse process data over time
Applicable to:Power BI visuals
41 out of 60

Drill Down Waterfall PRO (Filter) by ZoomChartsZoomChartsPower BI visualsControl column sequence, add subtotals and drill down into each category.
Applicable to:Power BI visuals
42 out of 60

Drill Down Timeline PRO (Pin) by ZoomChartsZoomChartsPower BI visualsExplore time-based data using columns or measures and multiple chart types: line, column, area.
Applicable to:Power BI visuals
43 out of 60

Text Enhancer by MAQ SoftwareMAQ LLCPower BI visualsCustomize the text in your Power BI reports | PBI certified
Applicable to:Power BI visuals
44 out of 60

Power Automate Process Mining - Variant DNA VisualMicrosoft Dynamics 365Power BI visualsVisualize business processes in a way that displays processes as if they were DNA blocks.
Applicable to:Power BI visuals
45 out of 60

KPI Treepbi-consultantsPower BI visualsVisualize and Explore Key Metrics Hierarchically with KPI Tree.
Applicable to:Power BI visuals
46 out of 60

Ridgeline Plot by PowervizTRUVIZ INCPower BI visualsVisualize the trends and distribution across multiple categories as density plots
Applicable to:Power BI visuals
47 out of 60

Laconic Card - FreeDotelus ABPower BI visualsA clutter-free card visual for displaying your KPIs.
Applicable to:Power BI visuals
48 out of 60

Walkers Animated PictogramWishyoulizationPower BI visualsAn animated pictographic bar chart for building visually appealing reports.
Applicable to:Power BI visuals
49 out of 60

Drill Down Combo PRO (Filter) by ZoomChartsZoomChartsPower BI visualsCombine columns, lines and areas in one chart. Enjoy interactive drilldowns and beautiful design.
Applicable to:Power BI visuals
50 out of 60

Clustered Stacked Column Chart (Pro)PBIVizEdit.comPower BI visualsTo compare two numerical variables by category with each column further segmented by sub-categories
Applicable to:Power BI visuals
51 out of 60

videoplayerpbiCraftPower BI visualsVideo player to watch any embedded video
Applicable to:Power BI visuals
52 out of 60

Symbol Chartpbi-consultantsPower BI visualsConnect your data to the real world, visualize it with symbols.
Applicable to:Power BI visuals
53 out of 60
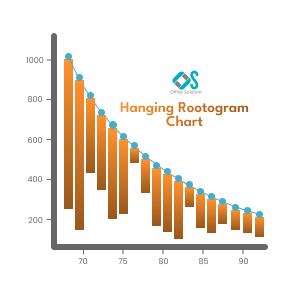
Hanging Rootogram Chart for Power BIOffice SolutionPower BI visualsA hanging rootogram chart is a specialized type of bar chart used in statistical analysis
Applicable to:Power BI visuals
54 out of 60

Multiple Axes Chart (Standard)PBIVizEdit.comPower BI visualsShow relationship between data sets by combining columns, lines, scatter, area on dual Y-axes
Applicable to:Power BI visuals
55 out of 60

Growth Rate Chart by DJEENI v1.4DJEENI BVPower BI visualsEnhance a line and column chart by adding extra relative or absolute column (growth) comparisons
Applicable to:Power BI visuals
56 out of 60

swBoxPlot上北智信Power BI visuals1.箱线图组件能够明确的展示离群点的信息,同时能够让我们了解数据是否对称,数据如何分组、数据的峰度
Applicable to:Power BI visuals

Dumbbell Bar ChartNova SilvaPower BI visualsUnleash the power of comparison with the Dumbbell Bar Chart
Applicable to:Power BI visuals
58 out of 60

Dot PlotMicrosoft CorporationPower BI visualsShow the distribution of frequencies in a great looking way
Applicable to:Power BI visuals
59 out of 60
Rotating Chart by MAQ SoftwareMAQ LLCPower BI visualsShowcase multiple key performance indicators with a rotating bar chart | PBI certified
Applicable to:Power BI visuals
60 out of 60